

2.3 Magnetism and In-Situ Dynamic Observation of SmCo₅ Permanent Magnetic Alloy During Annealing at 600-1000°C
Investigators undertaking in study of magnetics and magnetic materials have attached importance to mechanism of the coercivity of SmCo5 permanent magnetic alloy. Their reason to do so is that the theoretical coercivity permanent magnetic alloy of SmCo₅ is 31,840 kA/m but in practice generally the coercivity of the SmCo5 permanent magnetic alloy produced in factory is only 1360 - 2036 kA/m, about seventeenth of the theoretical value. The SmCo5 produced in laboratory has the maximum magnetic performance of 4776 kA/m (Zhou, et al, 1995), merely being sixth to seventh of the theoretical value. In addition mechanism of the coercivity can not be explained by conventional addition theory. Granule size of the SmCo5 is about \(D = 5 - 20\ \mu m\) and the size of its single domain is about \(D = 0.3 - 1.6\ \mu m\), that the former is about seventeen times of the latter. According to theory of the single domain the coercivity should be proportional with the anisotropy constant \(K_{1}\) of magnetic crystals and the \(K_{1}\) of the SmCo5 should be lowered with lowering of temperature so that the mechanism of coercivity is not consistent with the theory of the single domain. Moreover, the coercivity valley appeared in SmCo5 permanent magnetic alloy by annealing at 750°C, i.e., degraded to the minimum, but the coercivity rose at temperature from 750 - 950°C (Pan, Ma, Li, 1993).
To study above mentioned problem clearly will enrich the coercivity theory and magnetics theory and promote development of the coercivity theory and magnetics theory.
The difference in this study from the method of previous studies is that the observation was carried out dynamically using transmission electronic microscope under the condition of raising temperature from room temperature to 960°C. This innovative method may systematically and precisely observe the relationship among the precipitation of new phase, phase transformation and the coercivity, so that it is better in continuity and systematism than the previous study in one or two temperature points using a massive specimen.
Specimen Preparation and Experimental Methods for Studying SmCo₅ Magnets
SmCo5 sample was melted by alloy melting method. The sample was made of the nominal composition and melted in an arc furnace at protection atmosphere of argon. The alloy obtained was grinded by vibration ball miller and pulverized into powder of around 5 μm. The powder orientation formed under 1.5 T magnetic field and then sintered. The sintered sample was sliced into 0.3 mm lamellae by a linear cutter and then thinned to films of about 100 nm by ionic thinning device. The filmy specimen was placed into the side insertion heating dais of 1000 kV and observed dynamically by the transmission electronic microscope in heating condition. In the meantime the observation was videotaped. The accelerating voltage was 1000 kV (Pan, Ma, Li, 1993).
Chemical Composition Analysis of SmCo₅ Permanent Magnetic Alloy
The chemical composition of SmCo5 Permanent Magnetic Alloy is shown in Table 2.3.
Magnetic Measurement Techniques for SmCo₅ Permanent Magnetst
The measurement was carried out by using CL6 - 1 magnetic parameter measuring instrument. The specimen was prepared as per composition of permanent magnetic alloy listed in Table 2.4 and 4 samples were selected for measurement. The result of measurement of magnetic performance is shown as Table 2.4. The specimen was annealed in a heat treatment furnace at temperature from room temperature to 1000°C, annealing at selected temperature of 250°C, 420°C, 500°C, 600°C, 750°C, 850°C, 900°C, 950°C, 1000°C for one hour and quenching to room temperature, respectively. The specimen was measured in magnetic parameter measurement instrument. The result of the measurement is described as variation curve as shown in Fig. 2.10. It can be seen from the figure that the coercivity of SmCo5 permanent magnetic alloy appeared linear variation after annealing and
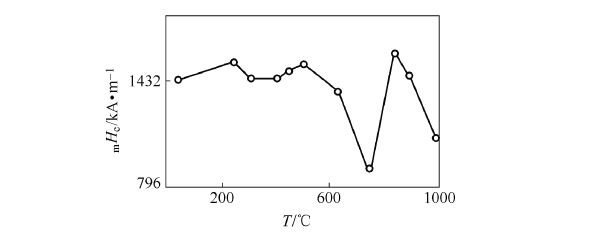
Fig. 2.10 The coercivity of SmCo5 specimen after 1h annealing at different annealing temperatures
reached the minimum at 750°C. Afterwards the coercivity was restored until 900°C.
Magnetic Domain Structure of SmCo₅: Formation and Behavior
Using method of Kerr magnetic - optical effect to observe structure of magnetic domain obtained a figure of magnetic domain as shown in Fig. 2.11 to Fig. 2.13. The figures are photographs of structure of magnetic domain being magnified by 600 times and observed by Kerr magnetic - optical effect at room temperature.
The photograph shown in Fig. 2.11 is the pattern of planar magnetic domain in vertical to easily magnetisable axis. It can be seen from Fig. 2.11 that the volume of the positive domain equals to the negative domain and has no magnetism.
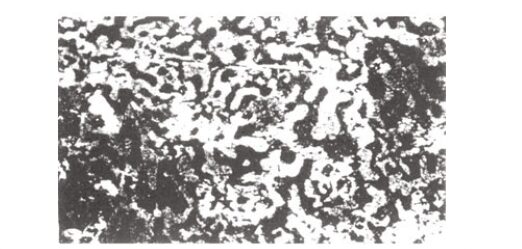
Fig. 2.11 Domain structure (600x) at thermal demagnetization
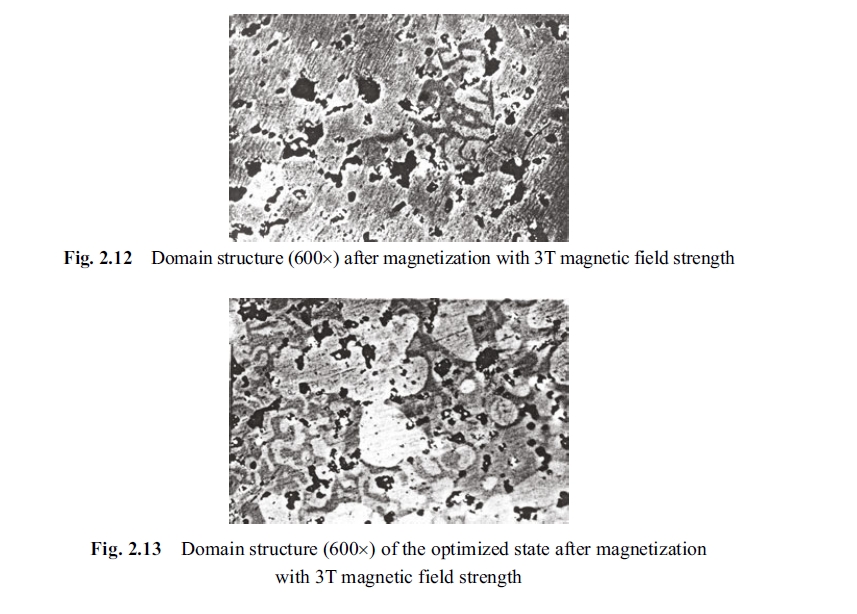
The Fig. 2.12 shows photographs of specimen of permanent magnetic alloy after magnetization under 3.0 T gauss magnetic field. The magnetization condition for Fig. 2.13 is the same as that of the Fig. 2.12. It can be seen from Fig. 2.13 that the volume of the positive domain decreased remarkably but the negative domain exhibited two traits: the first is the increase in number of the negative domain, the second is the widening of the negative domain. Pattern of the domain is like a labyrinthine.
Irreversible Loss of SmCo₅ Permanent Magnetic Alloy After Annealing at 25-1000°C
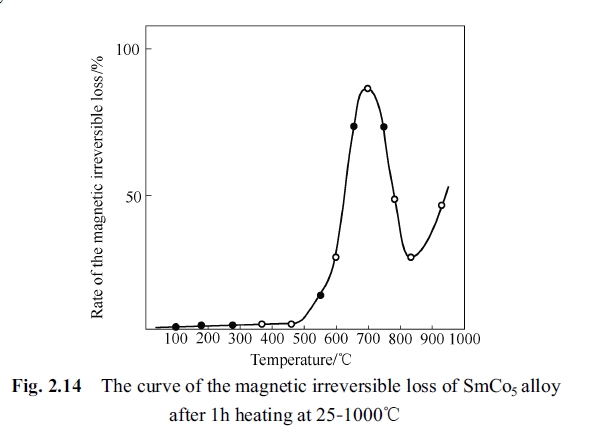
Experiment method was to hold the permanent magnetic alloy specimen for one hour at temperature 100°C, 200°C, 400°C, 500°C, 650°C, 700°C, 750°C, 800°C, 850°C, 900°C, 950°C, 1000°C, respectively, and quench the specimen to room temperature. Afterwards, their magnetism was measured and the irreversible loss was calculated. The measurement result was drawn to the variation curve as shown in Fig. 2.14 (comparison between magnetic performance before and after the annealing) (Pan, Ma, Li, 1993; Pan, Ren, Tan, 1983).
It can be seen from Fig.2.14 that its irreversible loss is very small when the annealing temperature was below 500°C. The magnetic irreversible loss becomes the biggest when the specimen was annealing at 750°C for one hour. By annealing at 900 - 1000°C for one hour the magnetic irreversible loss again increases gradually and by annealing at 750 - 900°C the magnetic irreversible loss decreases gradually.
Electronic Energy Spectrum Analysis of SmCo₅ Permanent Magnetic Allo
The electronic energy spectrum of SmCo5 alloy was measured at room temperature. Conditions for measurement of AES was: energy of incident electronic beam 3 keV, the beam current 1 μA, test voltage 60 V, multiplying voltage 1200 V, time constant 0.03 s, magnifying multiple 40 times and vacuum degree (2.66 - 3.99)×10⁻⁵ Pa ((2 - 3)×10⁻⁷ Torr). Main measurement condition of XPS was: using radiation of magnesium target as light source, voltage 8 kV, electric current 30 mA and flux energy 50 eV.
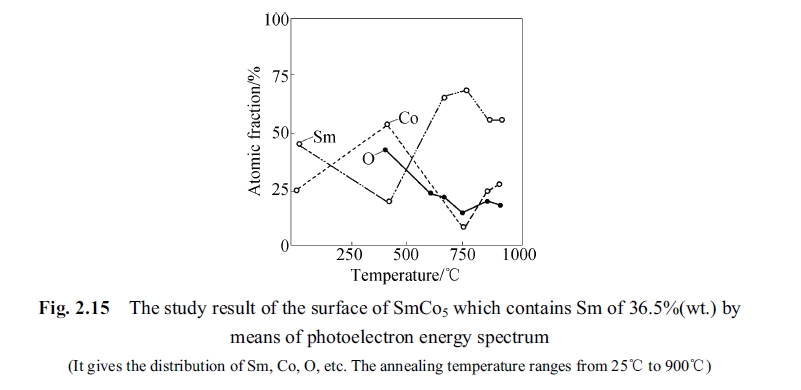
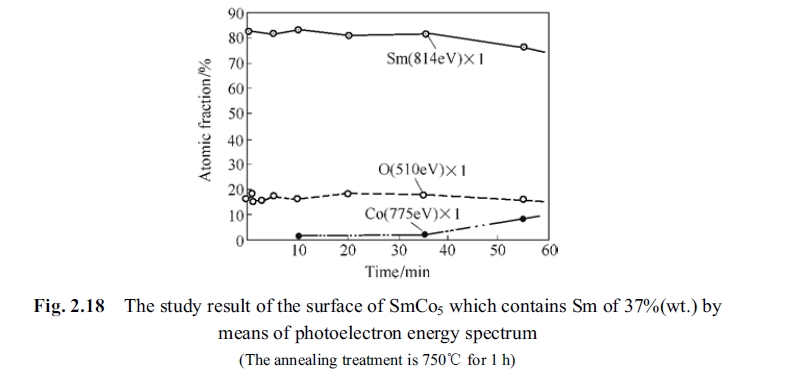
Fig. 2.15 shown the experimental result of optical electron energy spectrum measured for SmCo5 specimen after annealing at different temperature from 25°C to 900°C as per above mentioned conditions. It can be seen from the figure that the proportion of samarium and cobalt changed along with rising of temperature so that the samarium atoms enriched area or cobalt atoms enriched area appeared in interior of the alloy. The element segregating of samarium and cobalt atoms caused the alloy to be SmCo5 phase partly and the other phases (Sm2Co7 and Sm2Co17) in the other part. No matter the Sm2Co7 or Sm2Co17 their magnetic crystal anisotropy are all lower than that of SmCo5. Inhomogeneous of the solid solution magnetic crystal had a much lower anisotropy. This inhomogeneous area reduced gradually and the SmCo5 phase increased when the temperature was above 750°C and as the result the coercivity measured after quenched was enhanced. When this inhomogeneous was reduced to zero the homogeneous solid solution was quenched to room temperature as per proportion of SmCo5 phase and could hold the 1 : 5 phase. Then the coercivity could still be restored because the second phase could not be formed by element segregation but under an important premise that the oxygen should not be too high in the alloy. It can be seen from Fig. 2.15 that the oxygen did not increase along with rising of temperature so that the Sm2O3 was not formed in the alloy. An optic - electron energy spectrum experiment was designed to test the variation status of the elements of samarium, cobalt and oxygen. The specimen was annealing at high temperature of 750°C (heating under protection gas) for one hour and then quenched to room temperature. Afterwards, the optic - electron energy spectrum experiment was carried out. The distribution curve of elements of samarium, cobalt and oxygen of SmCo5 after annealing at 750°C for one hour was described as shown in Fig. 2.16 in accordance with peeling measured distribution of elements of samarium, cobalt and oxygen. The abscissa is the peeling time (min) and the ordinate is the atomic fraction. It can be seen from the figure that there was no peak value of oxygen.
To explain the problem, two specimens of the samarium - enriched SmCo5 alloy (containing high samarium content) were annealed at 750°C for one hour. The optic - electron energy spectrum experiment of distribution of elements of samarium, cobalt and oxygen and the measured curve is shown in Fig. 2.16. The optic - electron energy spectrum experiment of distribution of elements of samarium, cobalt and oxygen and the measured curve is shown in Fig. 2.17 for specimens annealed at different temperature from 25°C to 900°C for one hour.
The rare earth elements are easy to combine with oxygen to form rare earth oxides (such as Sm2O3) because of activity of the rare earth elements. Therefore, to
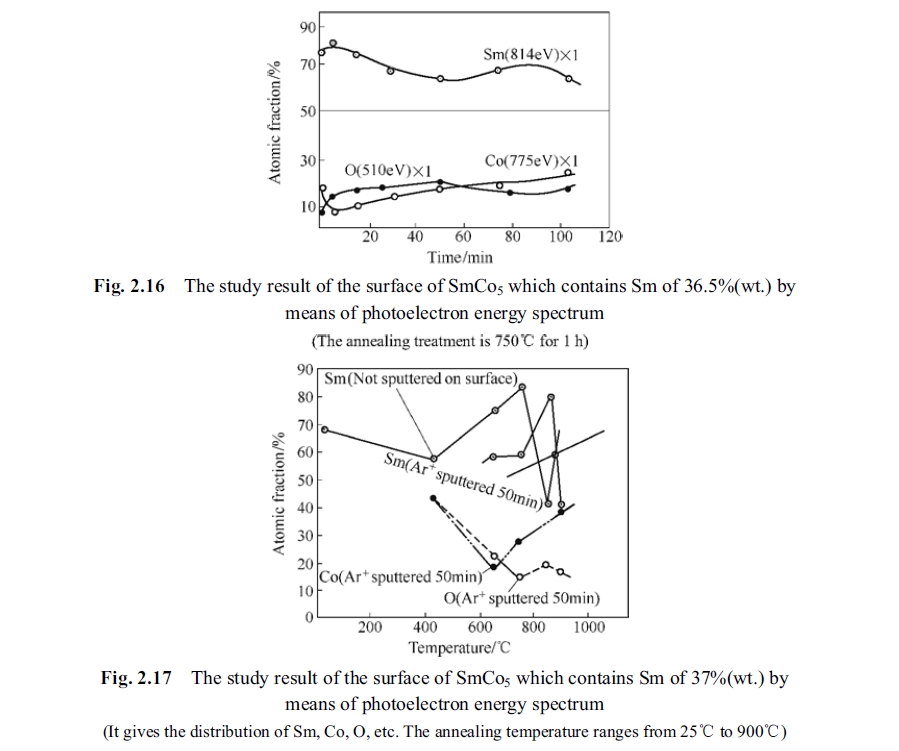
make a judge is to check whether appearing of the peak value. It can be seen from Fig. 2.17 and Fig. 2.18 that there is no peak value of the oxygen.
In-Situ and Dynamic Observation of Eutectoid Decomposition in SmCo₅ Using Electron Microscopy
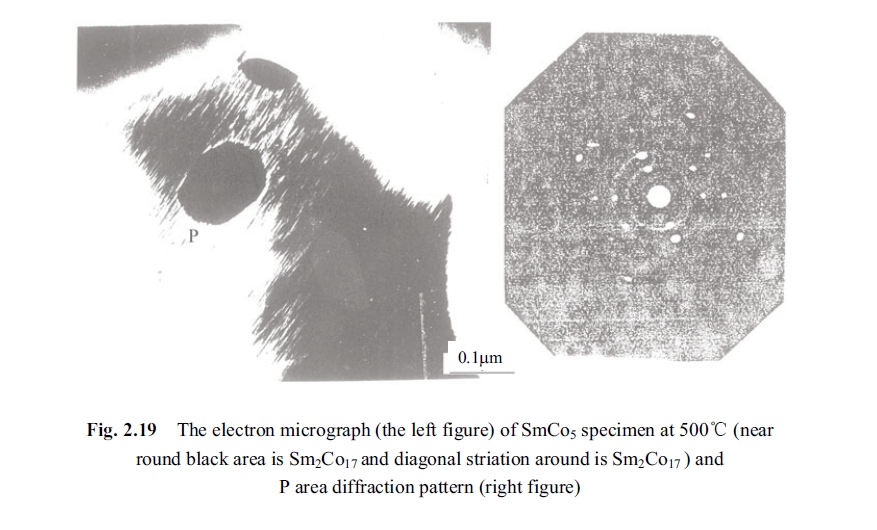
The above mentioned SmCo5 experimental specimen was sliced into lamellae of 0.25 mm in direction perpendicular to easy magnetisable axis. Then the lamellae were thinned to about 100 nm by electrolysis polishing and ionic thinning. The specimen film was placed into the side inserting and heating dais of JEM - 1000 and heated under condition of a vacuum degree of 266×10⁻⁷ Pa (2×10⁻⁷ Torr) and an accelerating voltage of 1000 kV. Then the dynamic observation was carried out. The Fig. 2.19 was the electronic micrograph (the graph of bright field) and the electronic diffraction pattern in P area of electronic micrograph being taken directly in thermal state inside of the electronic microscope when temperature of the filmy specimen was 500°C. Through diffraction and calculation of the precipitated tilted striate texture and approximate round black piece, respectively, it was testified: the precipitated tilted striate texture is Sm2Co7; the approximate round black piece texture is Sm2Co17. This result indicated that the eutectoid decomposition existed in SmCo5 permanent magnetic alloy at 500°C. The experiment also observed that the SmCo5 permanent magnetic alloy eutectoid decomposed remarkably into phases of Sm2Co7 and Sm2Co17 at 400°C, 600°C and 750°C, even appeared composition of the other phase.
In-Situ and Dynamic Observation of SmCo₅ in Thermal State Using Transmission Electron Microscopy
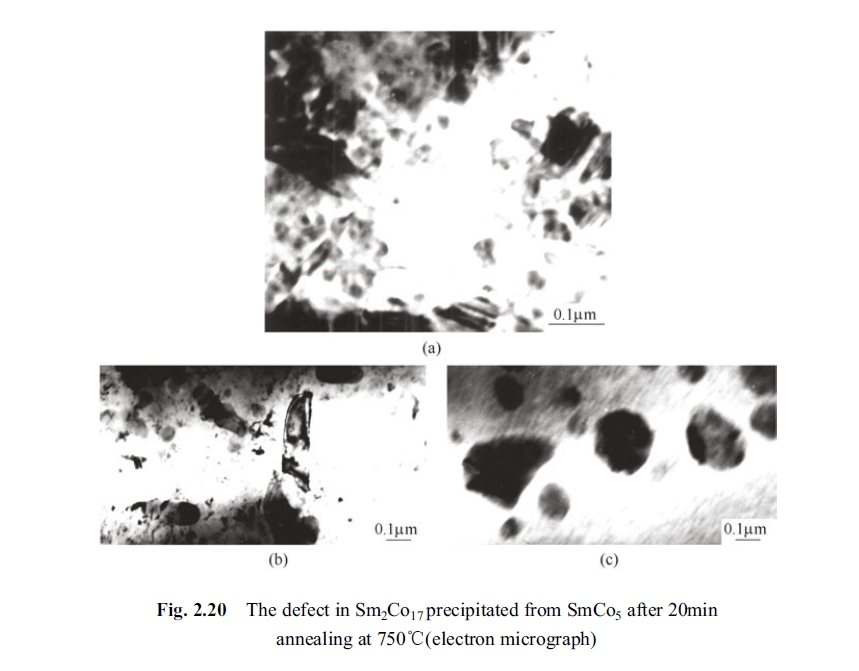
The phase precipitation was observed in the specimen of SmCo5 after holding at 750°C for 10 min. This precipitate phase was found as Sm2Co17, Sm2Co7 and other phase texture with different composition through electronic diffraction. The obvious defects in the newly precipitated Sm2Co17 phase could be observed clearly after holding for 20min. The Fig. 2.20 (a), (b) shown these defects by magnified 100 thousands times in the texture of precipitated Sm2Co17 phase.
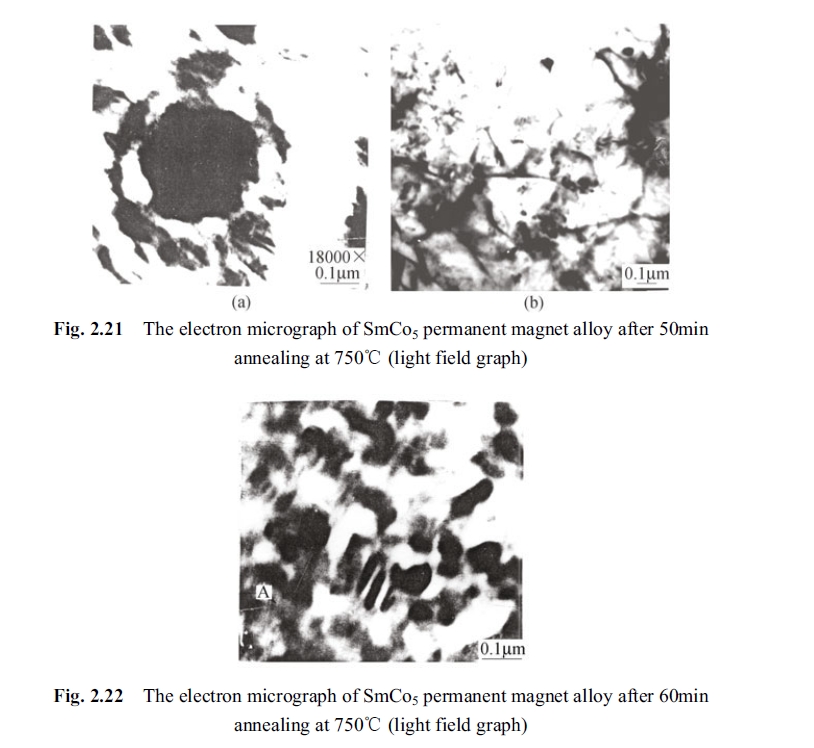
It was observed that the precipitated phase varied, dissolved, grown and aggregated, drastically after holding 30 min. The Fig. 2.21 (a), (b) shown the elements segregation appeared in the precipitated Sm2Co17 phase by holding at 750°C for 50 min. The black piece in the photograph was the precipitated Sm2Co17 phase. The element fluctuation and segregation of the precipitated Sm2Co17 phase were shown in Fig. 2.22 when holding for 60 min within the electronic microscope. It
can be seen from Fig. 2.22 that defects increased until to become a hole in the middle of the precipitated 2:17 phase. That some striation appeared in the figure is the other form of defect in the Sm2Co17 precipitated phase, and that to cause incomplete of the 2:17 phase and to enlarge segregation extent of phase composition. It was found in the electronic microscope that something like fog form appeared when holding for 80 min, but this fog like things disappeared along with increase of holding time and rising of temperature.
In-Situ and Dynamic Observation of SmCo₅ in Thermal Conditions (750-960°C) Using Transmission Electron Microscopy
The in situ and dynamic observation on SmCo5 specimen was carried out by holding for 1h at 750°C. Afterwards, the temperature was raised inside of electronic microscope from 750°C to 960°C to observe variation of the specimen directly in 1000 kV HVEM, seeing Fig. 2.23.
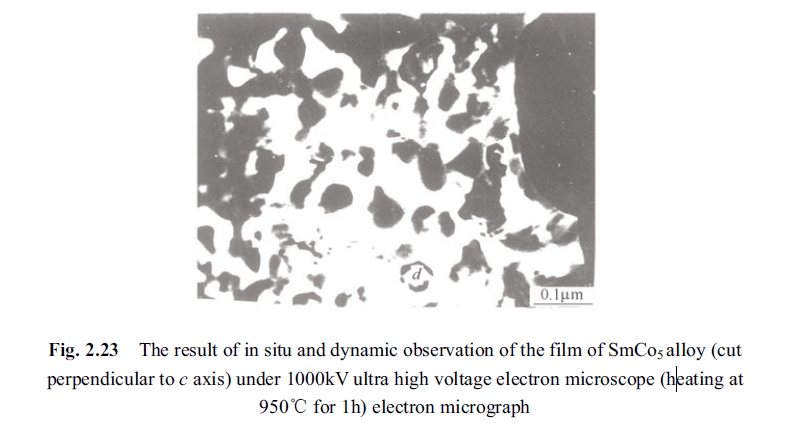
The phase transformation phenomenon is as follows:
- The fog state thing occurred at 750°C disappeared;
- All vision of the microtexture pattern became very clear;
- The striation type Sm2Co7 phase disappeared and the precipitated phase did not appeared after its disappearance;
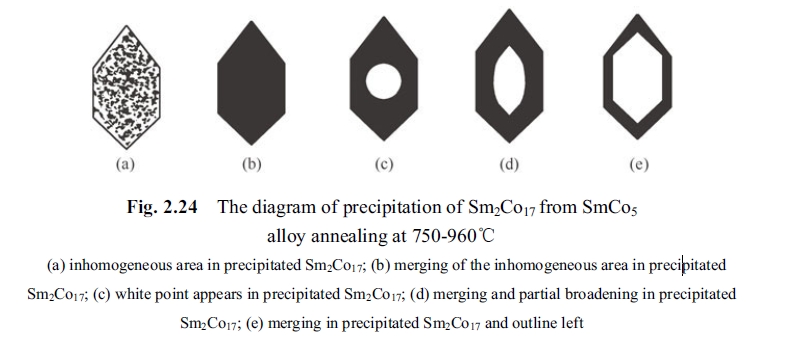
- The inhomogeneous area in texture of the precipitated phase of Sm2Co17 disappeared at 750°C and became an homogeneous precipitate phase, and its variation was in the following 5 procedures, seeing Fig. 2.24;
- Could not observe rhombus pillared dislocation and other typical dislocations which are easily to form the precipitated phase of Sm2Co17;
- The interphase boundary (intergradations area) between the matrix phase and
- the precipitated phase of Sm2Co17 disappeared at 750°C in observation;
- The whitened area in the precipitated phase of Sm2Co17 and the white area in the matrix phase were analyzed to be pure SmCo5 phase, and the X - ray diffraction peak of the alloy being quenched to room temperature as shown in Fig. 2.25.

Discussion: Key Insights into the Structural and Magnetic Evolution of SmCo₅
- The coercivity of permanent magnetic alloy is to indicate the magnetic density that magnetic induction intensity is zero on its static saturation magnetic hysteresis loop. The coercivity is the important parameter of permanent magnetic alloy and is the character for studying mechanism of magnetization reversal thus the study on coercivity may make various structures and nonstructural factors clearly instead. To analyze what factors which controls the coercivity of permanent magnetic alloy thereby to control consciously this factors in manufacturing process so that to enhance the coercivity and improve the magnetic performance of the permanent magnetic alloy (Li, Dai, 1982). Thus the scholars in study on the permanent magnetic alloy had great attention on the coercivity of SmCo5 and 2 - 17 type Sm - Co permanent magnetic alloys because the nonlinear variation of the SmCo5 alloy along with rising of temperature, that the coercivity of the alloy degraded to the minimum at 750°C when the alloy was annealed at temperature from 600 - 950°C but appeared a peak value at 750 - 950°C. This phenomenon could not be explained using conventional coercivity theory. Therefore, this study made use of advanced modern instruments and advanced methods and selected 1000 kV HVEM to observe the microtexture and structure of the phase precipitation and phase transformation. By using the HVEM we could observe the specimen of 100nm without any damage to the texture of specimen; could raise temperature from room temperature to 1000°C in the electronic microscope and so that to enable observation on phase transformation in the state of heat activation. It could observe directly in the electronic microscope that the Sm2Co7 phase, precipitated from the matrix phase of SmCo5, had some defects at 750°C. The defects in this type of nanometer crystalline phase texture possesses two fold characters, the big size defects is avail of nucleation and so that to degrade the coercivity; the small size defects is avail of acting as a pinning on the magnetic domain wall so that the defects may act as pinning point to enhance the coercivity. If supposing \(R\) is the radius of magnetization reversal nucleus, \(\nu\) is the energy density of magnetic do - main, and \(M_{s}\) is saturation magnetization intensity, in condition of given magnetization reversal nucleus radius the theoretical critical value for nucleation field \(H_{n}\) can be calculated by formula as follows:
\(2M_{s}H_{n}(4/3)\pi R^{3}=4\pi R^{2}\nu\)
The nucleation field:
\(H_{n}=(3/2)\nu/(M_{s}R)\)
For nucleation center of the Sm2Co17 phase if \(R = 10\)nm and \(100\)nm the \(H_{n}\) can be calculated by above formula as \(H_{n}=30\)kOe and \(3\)kOe, respectively. It can be seen from the calculation that the severe coarseness of \(H_{n}\) is attributed to the size of 100 nm of nucleation center. The nucleation locus mostly occurred in the area with weak anisotropy or biggish demagnetization of the magnetic crystal. A little decomposition flakes of RE2Co17 in SmCo5 and cobalt enriched SmCo5 samples on surface of crystalline granule due to some reasons, all of those cobalt precipitated locus are nucleation point of magnetization reverse. If nucleation in defects can reduce energy of magnetic domain wall and increase demagnetization thus in order to obtain high coercivity the first thing is to control nucleation to avoid big size defects, especially to prevent cobalt couple from forming and prevent oxidation and aberrance. We found by 1000 kV HVEM in the in situ and dynamic observation under state of heat activation that defects was lengthened obviously in the phase of Sm2Co7 precipitated from SmCo5 at 750°C. The measurement and calculation indicated that samples appeared the biggest irreversible loss at 750°C and some multi - defective areas with very low magnetocrystalline anisotropy existed in Sm2Co17 phase which became magnetization reverse nucleation centers so that the coercivity of SmCo5 permanent magnetic alloy was the minimum by annealing at 750°C.
2. For the reason of enhanced coercivity at temperature from 750°C to 850°C experiment provided that section explained as follows: the defects in Sm2Co17 phase precipitated at 750°C and inhomogeneous area disappeared gradually along with rising temperature from 800°C and 850°C, that was dynamic observed in transmission electronic microscope. The disappearing process is shown in Fig. 2.22. The variation process of hexagonal precipitated Sm2Co17 phase in \(d\) area of Fig. 2.23 is shown as (a)-(e) in Fig. 2.24. Homogenous Sm2Co17 phase (without multi - defect area in the precipitated phase) was precipitated from the matrix phase of SmCo5 without degradation in coercivity but even appeared small peak value (shown in Fig. 2.10). It can be seen from Fig. 2.21 that there is a certain interphases between the matrix phase and the precipitated phase (transition area)
and the structure of this interphase or say transition area acts important function on magnetization reverse domain (thickness of interphase close to 0.5 - 1.0 μm). As the composition and structure in the transition area the magnetization also varies so that this interphase causes big degradation in coercivity of the alloy. It can be seen from the figure that circumambience of the approximated round Sm2Co17 precipitated phase (the transition area between the matrix phase and Sm2Co17) disappeared so that the coercivity was enhanced. It can be seen from the optic - electron energy spectrum described in Fig. 2.15 to Fig. 2.18 that the short path segregation of samarium and cobalt elements appeared segregation junction at 750°C and this segregation junction of samarium and cobalt elements reduced at temperature from 750°C to 800°C being close to the proportion of the samarium and cobalt elements gradually the at 600°C (Pan, Ren, Tan, 1983). Thus this experiment explained why the coercivity enhanced again at 750°C to 800°C.
3. Why did the coercivity enhance after the SmCo5 permanent magnetic alloy annealing from 750°C to 800°C but be lower than the coercivity level at 600°C? This is because that the magnetic irreversible loss occurred in annealing, and from 750°C to above 800°C the process occurred that the inhomogeneous solid solution reduced gradually and homogenous solid solution increased gradually. This is consistent with the equilibrium diagram of SmCo5. This type of process from inhomogeneous to homogenous is caused by heat activation and the SmCo5 phase becomes homogenous solid solution. This state was held by quenching, i.e., heat demagnetization sample for measurement. Its phase analysis by X - ray diffraction is shown as in Fig. 2.25 that the sample is basically pure SmCo5.
Conclusions: Findings on Phase Transformation and Magnetic Properties of SmCo₅ Magnets
- The coercivity of SmCo5 permanent magnetic alloy showed a nonlinear variation after annealing. The minimum of the coercivity was attributed to precipitation of Sm2Co17 phase with multi - defect area and the interphase (transition area) between the matrix phase and the precipitated phase with a very low magnetic anisotropy which then became the anti - magnetic nucleation center.
- The enhancement of coercivity of the alloy at temperature from 750°C above 800°C was because of the function of heat activation by which the multi - defect areas in Sm2Co17 phase precipitated from SmCo5 alloy and on interphase between the matrix phase and the Sm2Co17 phase disappeared with segregation of samarium and cobalt elements and inhomogeneous segrega - tion junction of elements became homogenous solid solution so that the high magnetocrystalline anisotropy of SmCo5 was restored.
- The irreversible loss of SmCo5 permanent magnetic alloy measured after annealing was biggest at 750°C in the process from 25°C to 1000°C. This is because that the percent of homogenous solid solution in the mixture as per nominal composition formed by thermal state was lowered to the minimum at 750°C and the percent of inhomogeneous solid solution by segregation of samarium and cobalt elements became the maximum.


