
Cast Permanent Magnets of the Co-Cu-Sm and Co-Cu-Ce Systems: Composition, Properties, and Modifications
Substantial permanent - cast permanent magnets properties have been obtained in materials based on the rare - earth binary compounds by using solid solutions of \(\text{Co}_{5}\text{R}\) and \(\text{Cu}_{5}\text{R}\) [1]. The coercive force of these materials can be controlled by the precipitation of a second phase. This work is based mainly on the light rare - earth compounds because they have the highest values of magnetic saturation in addition to other assets. A number of these materials, which have high intrinsic coercive force, represent some of the most economical compositions of the rare - earth permanent - magnet alloys. This is especially true for the compositions in the vicinity of \(\text{Co}_{4.5 - z}\text{Cu}_{z}\text{Fe}_{0.5}\text{R}\), where \(R\) is
either cerium or a mixture of Ce and 90% Ce misch metal. When directionally Cast Permanent Magnets or directionally cooled, they can be substituted for the well - known but expensive platinum - cobalt alloys. If properly prepared, they can be cut into thin sections, drilled, and tapped. Sometimes these permanent magnets are cast to have isotropic properties [2]. Also, these alloys can be ground into coarse or fine particles, oriented, and sintered [3]. They can be ground into coarse powders (50 \(\mu\text{m}\) or larger), since precipitation of the second phase controls their coercive force values. The loose oriented powders could be embedded in a rubber or plastic matrix, if desired. The alloys can usually be magnetized in a field of 20,000 Oe.
For the most part, alloy buttons prepared by arc melting were used for the magnet studies described in this work. Magnets have also been produced by directional freezing in \(\text{Al}_{2}\text{O}_{3}\) crucibles (Bridgman method) and by use of oriented particles of these materials in sintered structures. The purity requirements of these elements are not stringent: the rare earths are usually 99.9%, Co 99.99%, Fe 99.99%, and Cu 99.99%. Magnetic measurements were made with a pendulum magnetometer (described in Appendix 4.1), and in some cases coercive force measurements were made by the torque method after magnetizing in fields up to 30,500 Oe.
Magnetic Properties of Alloys in the Co₅Sm-Cu₅Sm System: Performance and Applications
The variation of magnetic saturation and coercivity with copper content is shown in Figure 4.1. The as - cast samples made in the arc furnace are rapidly cooled on a water - cooled hearth, which results in a grain - oriented structure. A low - temperature anneal (\(400^{\circ}\text{C}\)) after casting increases the coer -
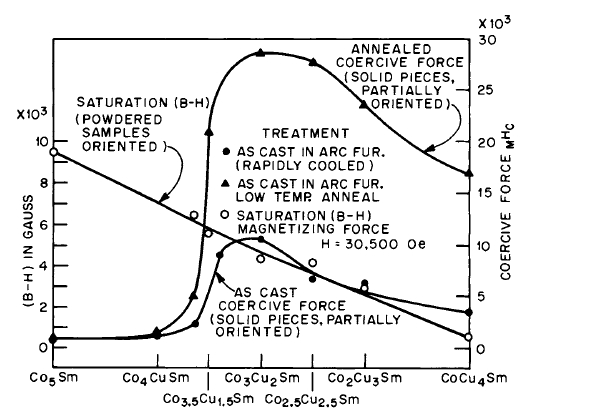
Figure 4.1 Intrinsic coercive force and magnetic saturation versus composition for the \(\text{Co}_{5}\text{Sm}-\text{Cu}_{5}\text{Sm}\) system. Magnetizing field for specimens was 30,500 Oe. (After Nesbitt et al. [1].)
cive force. Later work has shown that it is usually advantageous to homogenize castings at \(1000^{\circ}\text{C}\) [4]. Without the copper addition the castings have coercivities less than 1000 Oe, but in the vicinity of \(\text{Co}_{3.5}\text{Cu}_{1.5}\text{Sm}\) and \(\text{Co}_{3}\text{Cu}_{2}\text{Sm}\) the coercive force of the samples rises to the high value of 10,500 Oe and then decreases with further increase in copper content. The samples annealed at \(400^{\circ}\text{C}\) after arc casting behave in a similar manner, but the coercivities are much higher. As shown in Figure 4.1, the maximum coercive force obtained is approximately 28,000 Oe. The saturation magnetization of oriented powder specimens decreases approximately linearly from 9500 to 1000 G as the copper is increased from 0 to 55%
weight (Figure 4.1). For solid pieces, when the crystal orientation is random or not perfectly oriented, it would be difficult to attain these values of saturation with ordinary laboratory fields. Strnat et al. [5] determined an anisotropy field of approximately 200,000 Oe in the end - member \(\text{Co}_{5}\text{Sm}\) (Chapter III). The highest intrinsic coercive forces are exhibited by compositions in the vicinity of \(\text{Co}_{3}\text{Cu}_{2}\text{Sm}\) and \(\text{Co}_{2}\text{Cu}_{3}\text{Sm}\). For higher energy products, compositions of lower copper content, such as \(\text{Co}_{3.65}\text{Cu}_{1.35}\text{Sm}\), are required. The copper content is reduced to increase the saturation, but enough is retained to limit the reversal of the magnetization against the demagnetizing forces. The potential maximum energy product may be estimated on the basis of the criterion \((B - H)^{2}/4=(BH)_{m}\).
Figure 4.2 illustrates the effect of annealing temperature on
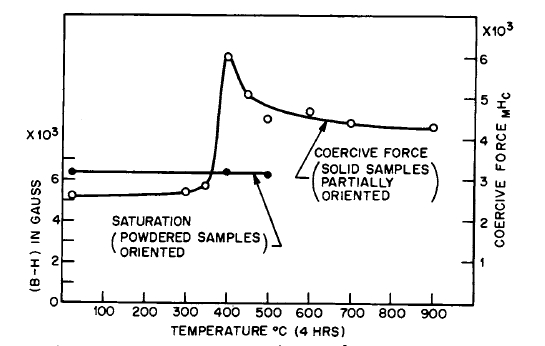
Figure 4.2 Intrinsic coercive force and magnetic saturation versus annealing temperature for the composition \(\text{Co}_{3.65}\text{Cu}_{1.35}\text{Sm}\). Data show a peak in the coercive force values after a \(400^{\circ}\text{C}\) anneal. (After Nesbitt [6].)
magnetic saturation and \(_{M}H_{c}\) for arc - cast materials of composition \(\text{Co}_{3.65}\text{Cu}_{1.35}\text{Sm}\). An aging peak occurs after an anneal at \(400^{\circ}\text{C}\). The value of the coercive force is approximately twice that of the as - cast state. The samples were not quenched after the aging treatment so that some effect of lower temperatures is present in the samples aged at temperatures above \(400^{\circ}\text{C}\). Annealing the alloy at low temperature does not appear to change the saturation values appreciably.
The addition of Fe to the Co - Cu - Sm alloys results in increased values of magnetization. The variation of intrinsic coercive force and magnetic saturation as a function of annealing temperature for the composition \(\text{Co}_{3.5}\text{Fe}_{0.5}\text{Cu}_{1.35}\text{Sm}\) is shown in Figure 4.3. An aging peak occurs at \(425^{\circ}\text{C}\), resulting in the coercive force increasing from 5200 to 10,000 Oe. This latter value is 4000 Oe higher than the corresponding peak in this system without the iron addition. Also, the satura -
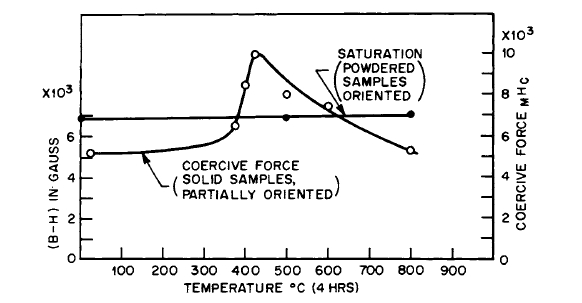
Figure 4.3 Intrinsic coercive force and magnetic saturation versus annealing temperature for the composition \(\text{Co}_{3.5}\text{Fe}_{0.5}\text{Cu}_{1.35}\text{Sm}\). The addition of iron to the ternary composition increased both the coercive force and magnetic saturation. (After Nesbitt [6].)
value is 6900 G, which is 500 G higher than the value without the iron addition. Thus, the addition of iron increases both the coercive force and saturation values of the alloy. The 500 - G increase is important because the energy product varies with the square of the saturation.
Theuerer et al. [7], using the composition \(\text{Co}_{3.65}\text{Cu}_{1.35}\text{Sm}\), obtained intrinsic coercive forces of 30,000 and 13,300 Oe on sputtered films of thickness 5000 and 50,000 Å respectively. In these alloys, the values of coercive force can vary considerably because of a number of factors, one of which is the degree of crystal orientation, which is not known in these polycrystalline specimens. In general, samples that have their easy direction of magnetization along the direction of the applied field have a lower coercive force than samples containing randomly oriented crystals. Also, the high values of coercive force obtained by Theuerer suggest that the fine grain size of sputtered films is an important factor.
The Impact of Heat Treatment on Co₅Sm-Cu₅Sm Alloys: Enhancing Magnetic Properties
Additional studies were conducted whereby specimens were annealed at various temperatures and quenched to room temperature. Aging studies subsequent to quenching were also carried out. Figure 4.4 shows a plot of the intrinsic coercive force \(_{M}H_{c}\) versus quenching temperature for a \(\text{Co}_{3.5}\text{Fe}_{0.5}\text{Cu}_{1.35}\text{Sm}\) alloy [8]. Specimens used in these experiments were small arc - melted buttons ranging in size from approximately one - fourth to one - half inch in diameter. Samples quenched in water from temperatures in the range of 800 to \(1100^{\circ}\text{C}\) had a coercive force of approximately 4000 Oe. On aging these samples at \(400^{\circ}\text{C}\), the coercive force increased
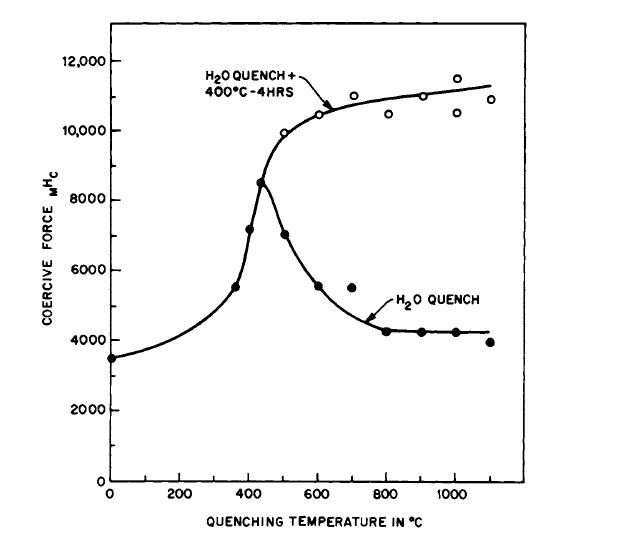
Figure 4.4 Intrinsic coercive force versus quenching temperature for the alloy \(\text{Co}_{3.5}\text{Fe}_{0.5}\text{Cu}_{1.35}\text{Sm}\) (filled circles). Also shown are the values of coercive force after aging at \(400^{\circ}\text{C}\) for 4 hr subsequent to the indicated temperature of quenching (open circles). (After Nesbitt et al. [8].)
to approximately 11,000 Oe. This behavior suggests that there is a decreasing solubility of one or more components with decreasing temperature. When the quenching temperatures are lower than \(800^{\circ}\text{C}\), the coercive force values obtained by quenching and aging at \(400^{\circ}\text{C}\) are still higher than thoseobtained by aging at \(400^{\circ}\text{C}\) alone. When a small button is cooled from the melt at approximately \(10^{\circ}\text{C/sec}\) and aged at \(400^{\circ}\text{C}\), it has a coercive force between 7000 and 8000 Oe, which is lower than that obtained by quenching from temperatures in the range of 500 to \(800^{\circ}\text{C}\) and aging at \(400^{\circ}\text{C}\). The maximum energy product of these samples for both types of heat treatment is approximately \(9\times10^{6}\text{ G - Oe}\). Higher values of \((BH)_{m}\) can be obtained using \(1000^{\circ}\text{C}\), with cooling at approximately \(1^{\circ}\text{C/sec}\) plus four or more hours at \(400^{\circ}\text{C}\). Figure 4.5 shows a plot of the intrinsic coercive force versus aging temperature for specimens initially quenched in water at \(1000^{\circ}\text{C}\). There is a sharp peak in the vicinity of \(400^{\circ}\text{C}\), which indicates that this is the best aging temperature for four hours of heat treatment.
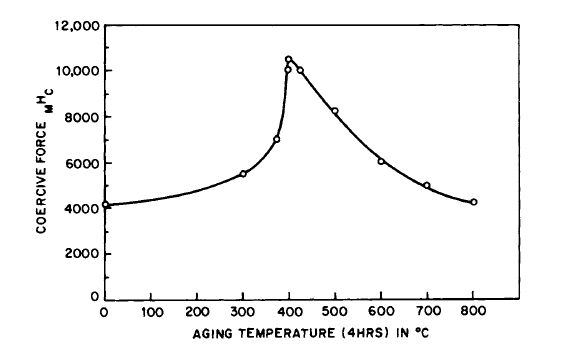
Figure 4.5 Intrinsic coercive force versus aging temperature for the alloy \(\text{Co}_{3.5}\text{Fe}_{0.5}\text{Cu}_{1.35}\text{Sm}\). Specimens were quenched in water from \(1000^{\circ}\text{C}\), then aged at indicated temperatures, and finally quenched in water. (After Nesbitt et al. [8].)
Magnetic Properties of Alloys in the Co₅Ce-Cu₅Ce System: Structure and Performance
The variation of magnetic saturation and intrinsic coercive force with copper content is shown in Figure 4.6. For as - cast material in the vicinity of \(\text{Co}_{3.5}\text{Cu}_{1.5}\text{Ce}\) and \(\text{Co}_{3}\text{Cu}_{2}\text{Ce}\), the intrinsic coercive force rises to a value of 4500 Oe and then decreases with increase in copper content. The aged samples (\(400^{\circ}\text{C}\)) behave in a similar manner, but the coercive force rises to higher values. As shown in Figure 4.6, the coercive force rises to a value of 10,500 Oe, which is lower than that
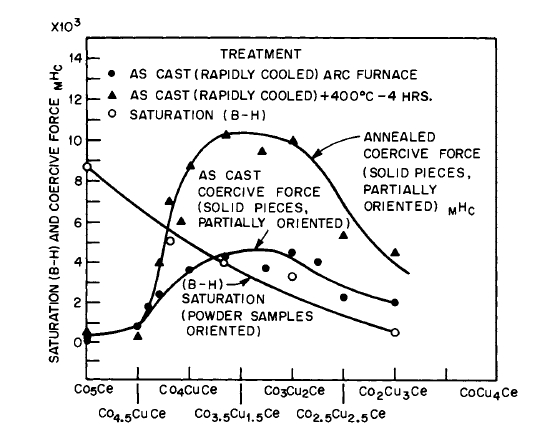
Figure 4.6 Intrinsic coercive force and magnetic saturation versus composition for the \(\text{Co}_{5}\text{Ce}-\text{Cu}_{5}\text{Ce}\) system. Magnetizing field was 30,500 Oe. (After Nesbitt [6].)
obtained in the \(\text{Co}_{5 - z}\text{Cu}_{z}\text{Sm}\) system. However, the values are sufficiently high for most applications, and Ce has the advantage of being substantially cheaper than Sm. In later work, the coercive force values for Ce alloys were increased [4]. Figure 4.7 shows the coercive force and magnetic saturation of the composition \(\text{Co}_{4}\text{CuCe}\) after annealing the cast ingot at various temperatures. It appears that an aging peak also occurs in this system after an anneal at \(375^{\circ}\text{C}\), and the coercive force increases from 3000 to 5600 Oe.
Figure 4.8 shows the intrinsic coercive force and magnetic saturation of \(\text{Co}_{3.5}\text{Cu}_{1.25}\text{Fe}_{0.5}\text{Ce}\) after annealing at various temperatures. An aging peak occurs at \(425^{\circ}\text{C}\). The coercive force increases from 6200 to 10,200 Oe. As occurs in the \(\text{Co}_{5 - z}\text{Cu}_{z}\text{Sm}\) system, the coercive force and saturation values increase by the addition of Fe.
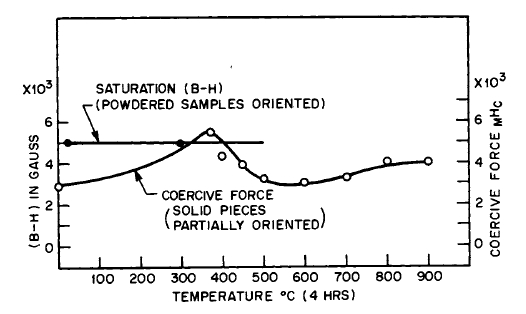
Figure 4.7 Intrinsic coercive force and magnetic saturation versus annealing temperature for the composition \(\text{Co}_{4}\text{CuCe}\). Data show a peak in the coercive force after a \(375^{\circ}\text{C}\) anneal. (After Nesbitt [6].)
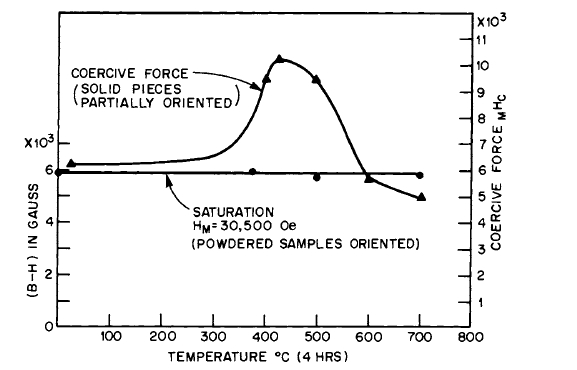
Figure 4.8 Intrinsic coercive force and magnetic saturation versus annealing temperature for the composition \(\text{Co}_{3.5}\text{Cu}_{1.25}\text{Fe}_{0.5}\text{Ce}\). The addition of iron to the ternary composition increased both the coercive force and magnetic saturation. (After Nesbitt [6].)
The effect of copper on the demagnetization curves is illustrated in Figure 4.9 [4]. The intrinsic coercive force varies from 5000 to 11,400 Oe with increasing copper content. Larger values of \(_{M}H_{c}\) could be obtained by further increasing the copper content. The squareness of the curves indicate satisfactory crystal orientation. The \(B\) demagnetization curves for these data are shown in Figure 4.10. The curves are linear for the alloys containing 1.2 and 1.7 atomic parts of copper. The 0.9 Cu alloy exhibits a \((BH)_{\text{max}}\) of \(9.8\times10^{6}\text{ G - Oe}\), with a residual induction of 6330 G and an \(H_{c}\) of 5200 Oe. The alloy containing 0.75 Cu exhibits a \((BH)_{\text{max}}\) of \(9.0\times10^{6}\)
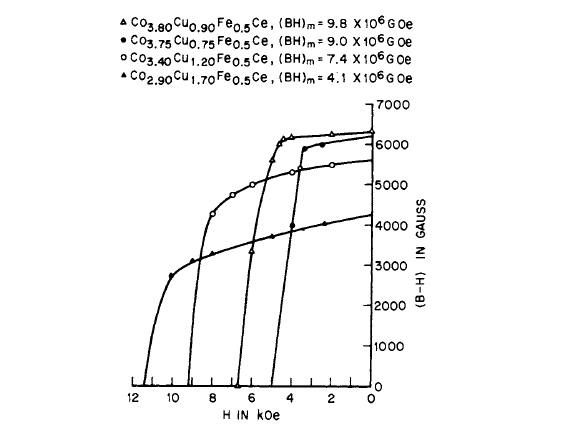
Figure 4.9 \((B - H)\) versus intrinsic coercive force for four alloys containing different amounts of copper. Intrinsic coercive force varies from 5000 to 11,400 Oe. For \(\text{Co}_{3.5}\text{Cu}_{0.9}\text{Fe}_{0.5}\text{Ce}\), \((BH)_{m}=9.8\times10^{6}\text{ G - Oe}\), \(B_{r}=6330\) G, and \(_{B}H_{c}=5200\) Oe. These properties are roughly equivalent to those of PtCo. (After Nesbitt et al. [4].)
G - Oe, with a \(B_{r}\) of 6200 G and an \(H_{c}\) of 4000 Oe. As can be noted from Figure 4.10, these last two demagnetization curves are slightly curved.
Figure 4.11 contains plots of \((B - H)\) and \(B\) versus \(H\) for specimens obtained from a 1 - in. diam \(\times\) 3 - in. long ingot grown by the Bridgman technique. The magnetic properties are \(B_{r}=6100\) G, \(_{B}H_{c}=4500\) Oe, \(_{M}H_{c}=7000\) Oe, and \((BH)_{\text{max}}=9\times10^{6}\text{ G - Oe}\). Directional solidification was accomplished by passing the crucible \((\text{Al}_{2}\text{O}_{3})\) through a fur -
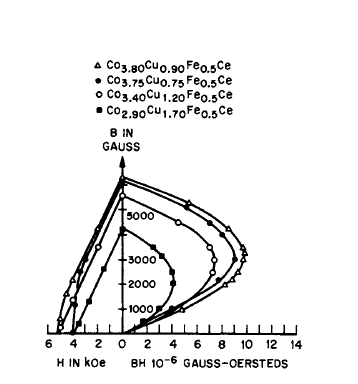
Figure 4.10 \(B\) versus coercive force for four alloys containing different amounts of copper. For the alloys containing 1.2 and 1.7 atomic parts of copper, the curves are linear. The alloy containing 0.9 copper has a maximum energy product of \(9.8\times10^{6}\text{ G - Oe}\) with a residual induction of 6330 G and a coercive force when \(B = 0\) of 5200 Oe. (After Nesbitt et al. [4].)
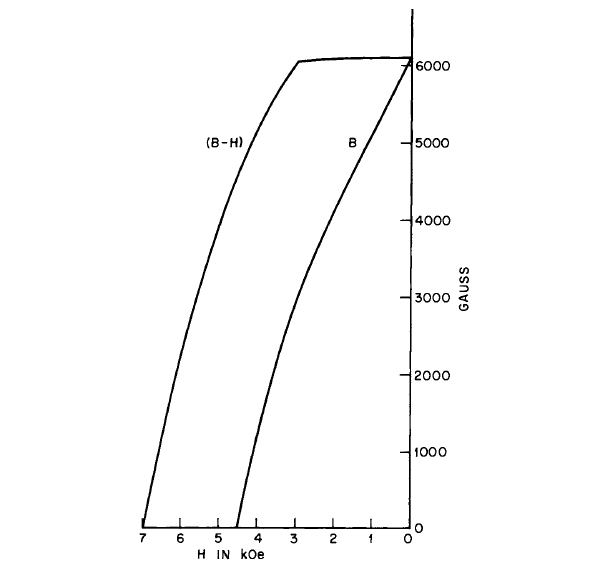
Figure 4.11 Plot of \((B - H)\) and \(B\) demagnetization curves for a 1 - in. diam \(\times\) 3 - in. long specimen of the alloy \(\text{Co}_{3.5}\text{CuFe}_{0.5}\text{Ce}\) grown by the Bridgman method. The magnetic properties are \(B_{r}=6100\) G, \(_{B}H_{c}=4500\) Oe, \(_{M}H_{c}=7000\) Oe, and \((BH)_{m}=9\times10^{6}\text{ G - Oe}\). These results show that the Bridgman method is capable of producing large diameter, long, oriented bars of these alloys. (After Chin et al. [9].)
nace at 1 in./hr (argon atmosphere); texture measurements showed good alignment of the crystals [9]. These results show that directional solidification techniques are useful for obtaining long, large - diameter, oriented ingots of these alloys [9]. Ingots having diameters well in excess of one inch have been prepared commercially, as reported by Cullen [2].
Heat Treatment Effects on the Co₃.₅Fe₀.₅CuCe Alloy: Enhancing Magnetic Behavior
Figure 4.12 illustrates how the intrinsic coercive force \(_{M}H_{c}\) of the cast alloy \(\text{Co}_{3.5}\text{Fe}_{0.5}\text{CuCe}\) varies after heating at indicated temperatures and then quenching into water. Also shown
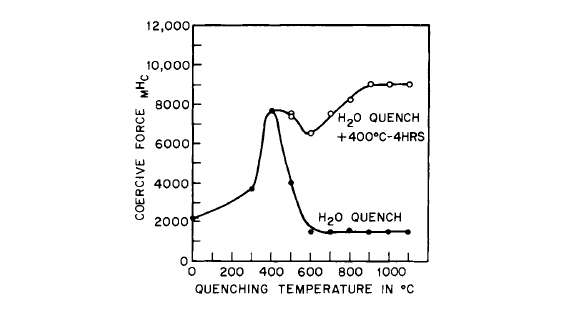
Figure 4.12 Intrinsic coercive force versus quenching temperature for the alloy \(\text{Co}_{3.5}\text{Fe}_{0.5}\text{CuCe}\) (filled circles). Values of 1500 Oe were obtained after quenching at the higher temperatures. Also shown are the values of coercive force after aging at \(400^{\circ}\text{C}\) for 4 hr (open circles), which followed quenching from the indicated temperatures. (After Nesbitt et al. [8].)
are the values of coercive force after aging at \(400^{\circ}\text{C}\) for 4 hr subsequent to the quenching. Specimens used in this experiment were small arc - melted buttons ranging in size from approximately ⅜ to ½ in. in diameter. It may be seen that samples quenched in water from temperatures in the range of 600 to \(1100^{\circ}\text{C}\) had coercive forces of approximately 1500 Oe. On aging these samples at \(400^{\circ}\text{C}\), the coercive force increased substantially. This behavior suggests a decreasing solubility of one or more components with decreasing temperature [8]. As shown in Figure 4.12, the maximum effect was obtained by quenching in water from the region 900° to \(1100^{\circ}\text{C}\) and then aging at \(400^{\circ}\text{C}\) for 4 hr, which yielded an intrinsic coercive force of approximately 9000 Oe. When the quenching temperatures are below \(900^{\circ}\text{C}\), the coercive force values obtained by quenching in water and aging at \(400^{\circ}\text{C}\) approach those obtained by aging at \(400^{\circ}\text{C}\) alone. For example, when a small button is cooled from the melt at approximately \(10^{\circ}\text{C/sec}\), it has a coercive force of 2000 Oe, as shown in Figure 4.12. After aging at \(400^{\circ}\text{C}\), it has a coercive force between 7000 and 8000 Oe, which is close to that obtained by quenching in water from the region of 500 to \(900^{\circ}\text{C}\) and aging at \(400^{\circ}\text{C}\).
Figure 4.13 shows a plot of intrinsic coercive force versus aging temperature for specimens initially quenched in water from \(1000^{\circ}\text{C}\) and quenched in water after the aging treatment. There is a sharp peak in the values of the coercive force in the vicinity of \(400^{\circ}\text{C}\), which indicates that this is the best aging temperature. If the samples are not drastically quenched after aging above \(400^{\circ}\text{C}\), a curve approaching the upper curve in Figure 4.12 will be obtained. These data suggest that there may be an intermediate cooling rate that is beneficial. This appears to be the case, and it has been found that an optimum heat treatment for this alloy is \(1000^{\circ}\text{C}\),
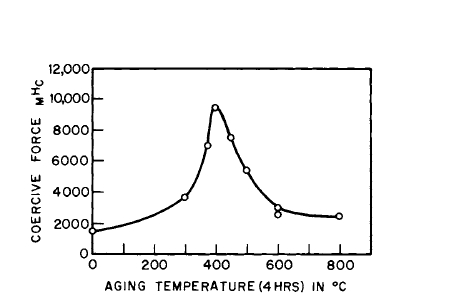
Figure 4.13 Intrinsic coercive force versus aging temperature for the alloy \(\text{Co}_{3.5}\text{Fe}_{0.5}\text{CuCe}\). Specimens were quenched in water from \(1000^{\circ}\text{C}\), then aged at the indicated temperature, and finally quenched in water. The peak at \(400^{\circ}\text{C}\) indicates that this is the best aging temperature. (After Nesbitt et al. [8].)
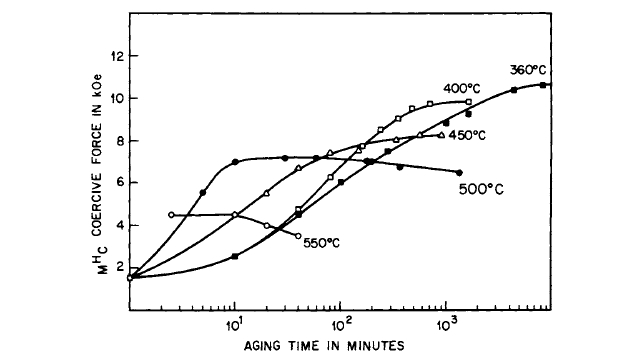
Figure 4.14 Intrinsic coercive force versus time for the alloy \(\text{Co}_{3.5}\text{Fe}_{0.5}\text{CuCe}\). Specimens were quenched in water from \(1000^{\circ}\text{C}\), then aged at various temperatures, and finally quenched in water. Aging temperatures of \(360^{\circ}\text{C}\) and \(400^{\circ}\text{C}\) yield highest values of coercive force.
cooled at approximately \(1^{\circ}\text{C/sec}\), followed by \(400^{\circ}\text{C}\) for 4 hr. However, for this alloy the differences in properties between the quench plus \(400^{\circ}\text{C}\) bake versus \(1000^{\circ}\text{C}\), cooled \(1^{\circ}\text{C/sec}\), plus \(400^{\circ}\text{C}\) bake are not great. Similar heat - treating results have been found when the alloy contains Sm instead of Ce.
Figure 4.14 shows the effect of time on the coercive force of small arc - melted buttons quenched in water from \(1000^{\circ}\text{C}\) and subsequently aged at various temperatures and finally quenched in water. Aging at 360 and \(400^{\circ}\text{C}\) yielded the highest values. Substantial but lower values of coercive force can be obtained by aging at \(500^{\circ}\text{C}\) for short periods of time. At \(550^{\circ}\text{C}\), the specimens are apparently overaged.
Summary of Magnetic Properties of Co₄.₅₋ₓCuₓFe₀.₅Ce Alloys
Figure 4.15 shows the important magnetic properties of these alloys as a function of copper content. The highest maximum energy product occurs in the vicinity of 0.9 atomic parts copper. The intrinsic coercive force of the alloys continues to rise throughout the range of copper content shown. Further refinement of the heat treatment (e.g., low temperature aging for longer periods of time and a better controlled cooling rate from the high temperatures) should improve the properties of the alloys having less than 1.0 atomic part of copper.
Figure 4.16 shows samples of the alloy \(\text{Co}_{3.6}\text{Cu}_{0.9}\text{Fe}_{0.5}\text{Ce}\). Those in the bottom row are arc - melted buttons, two of which have had holes drilled in them. In the middle of the top row is a sample made by powder metal -
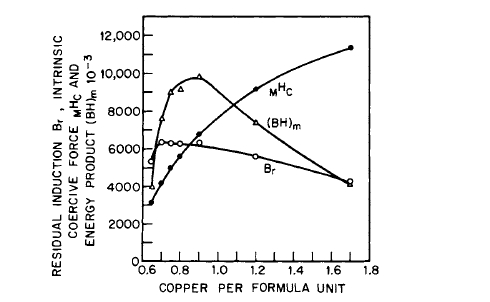
Figure 4.15 \(B_{r}\), \(_{M}H_{c}\), and \((BH)_{m}\) versus copper content for alloys of the system \(\text{Co}_{4.5 - z}\text{Cu}_{z}\text{Fe}_{0.5}\text{Ce}\). The plot summarizes properties for cast alloys in this system.
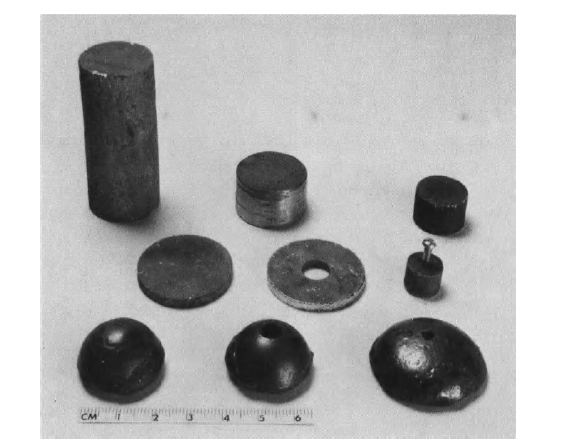
Figure 4.16 Samples of the alloy \(\text{Co}_{3.6}\text{Cu}_{0.9}\text{Fe}_{0.5}\text{Ce}\). The bottom row shows arc - melted buttons. The middle row illustrates slices from longer castings. In the top row, the middle piece was made by powder metallurgy.
lurgy techniques. The other samples are slices cut from longer cast pieces. One sample has a tapped hole with a screw in it.
External Magnetic Fields in Arc-Melted Buttons: Their Role in Magnetism
One - inch diameter cast buttons of \(\text{Co}_{3.6}\text{Fe}_{0.5}\text{Cu}_{0.9}\text{Ce}\) supply a convenient and economical way of obtaining high permanent magnet fields in an air gap. As a result of the way the
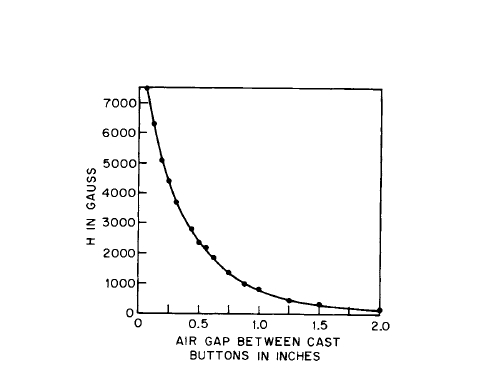
Figure 4.17 Field at center of air gap versus distance between parallel faces of two arc - melted cast buttons of \(\text{Co}_{3.5}\text{CuFe}_{0.5}\text{Ce}\)
buttons are cooled during casting, the crystal anisotropy tends to be directed toward the axis of the button. Figure 4.17 shows the field at the center of the air gap versus the distance between parallel faces of the buttons. For a separation of ½ in., a field of 2400 Oe is obtained at the center between the two buttons. In this instance, there is no magnetic return circuit between the two button magnets. The overall length of the magnets plus air gap is only 1½ in., and each magnet weighs 38 g. The button magnets have a diameter of 1 in., are ½ in. thick in the center, and roughly resemble a hemisphere. Such arrangements have successfully supplied fields for an optical isolator [10].
Magnetic Properties of Cast Alloys in the Co-Cu-Fe-Ce-Sm System: Impact of Misch Metal (MM) Substitution
Alloys containing mixtures of Ce and Sm exhibit higher energy products than the Ce alloys, but they are more expensive because of the use of Sm. In general, they can be treated in a manner similar to that used for the straight Ce alloys, i.e., they can be cast or ground to powder to produce oriented sintered magnets.
The demagnetization curves of a number of Co - Cu - Fe - \((\text{Ce}_{0.25}\text{Sm}_{0.75})\) alloys are shown in Figure 4.18. Note that \(_{M}H_{c}\) varies from 4200 to 13,400 Oe and the residual induction from 7200 to 4300 G. The higher the copper content, the larger \(_{M}H_{c}\), and even larger values of \(_{M}H_{c}\) can be obtained by further increasing copper content. Figure 4.19 contains the \(B\) vs. \(H\) and \((BH)\) curves for these alloys. \((BH)_{\text{max}}\) varies from 4.6 to \(12.3\times10^{6}\text{ G - Oe}\); the highest value of \((BH)_{\text{max}}\) is exhibited
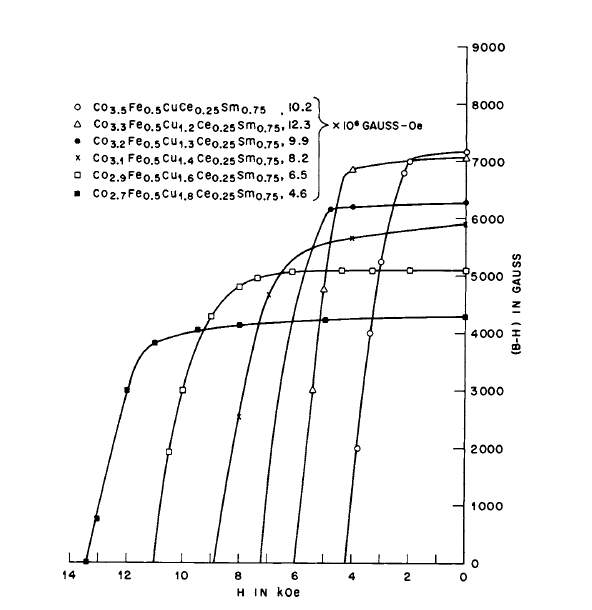
Figure 4.18 Intrinsic permanent magnet properties of six alloys of the Co-Cu-Fe-Ce-Sm system containing different amounts of copper. Intrinsic coercive force varies from 4200 to 13,400 Oe and residual induction varies from 7200 to 4300 G with increasing copper content. (After Nesbitt et al. [11].)
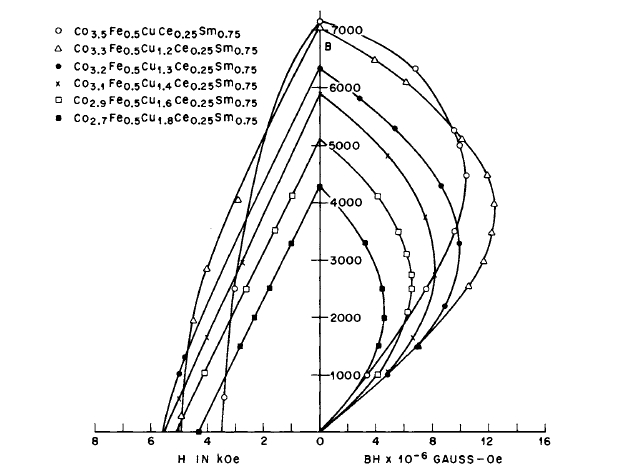
Figure 4.19 Permanent magnet properties of six alloys of the Co - Cu - Fe - Ce - Sm system containing different amounts of copper. \(_{B}H_{c}\) varies from 4300 to 5600 Oe with increasing amounts of copper. The maximum energy product of \(\text{Co}_{3.3}\text{Cu}_{1.2}\text{Fe}_{0.5}\text{Ce}_{0.25}\text{Sm}_{0.75}\) is \(12.3\times10^{6}\text{ G - Oe}\), \(B_{r}=7070\) G, and \(_{B}H_{c}=5000\) Oe. (After Nesbitt et al. [11].)
by the alloy \(\text{Co}_{3.3}\text{Fe}_{0.5}\text{Cu}_{1.2}\text{Ce}_{0.25}\text{Sm}_{0.75}\). Linear \(B\) demagnetization curves are exhibited by alloys containing 1.4, 1.6, and 1.8 atomic parts Cu, whereas those having lower Cu contents exhibit slightly curved demagnetization curves.
Figure 4.20 compares the intrinsic demagnetization curves for alloys having different Sm contents. One of the effects of samarium is to increase the residual induction and lower the
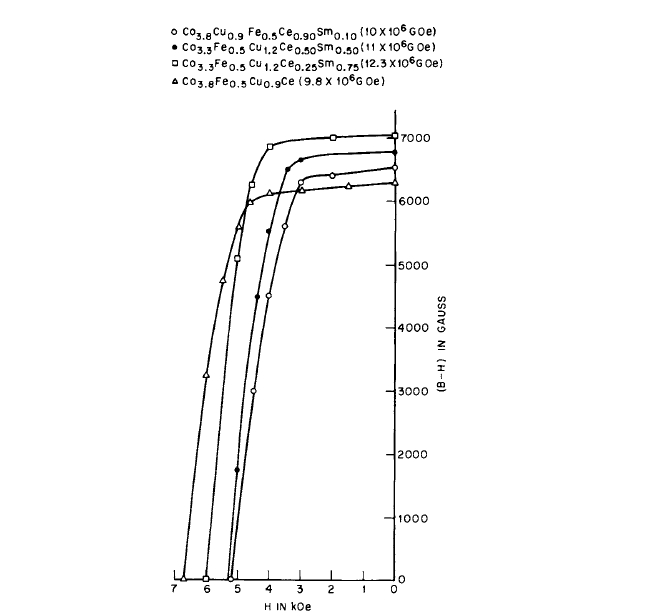
Figure 4.20 Intrinsic permanent magnet properties of alloys with an increasing amount of Sm substituted for Ce. The effect of increasing Sm is to increase the saturation and residual induction and decrease the coercive force
coercive force. This result is due to the fact that samarium increases the saturation value of the alloy and also appears to increase the solubility of the copper - rich phase in comparison with cerium, and this lowers the coercive force. Of course, much higher values of coercive force could be obtained with increased amount of samarium in the alloys, but it is necessary to also increase the copper content. Figure 4.21 shows
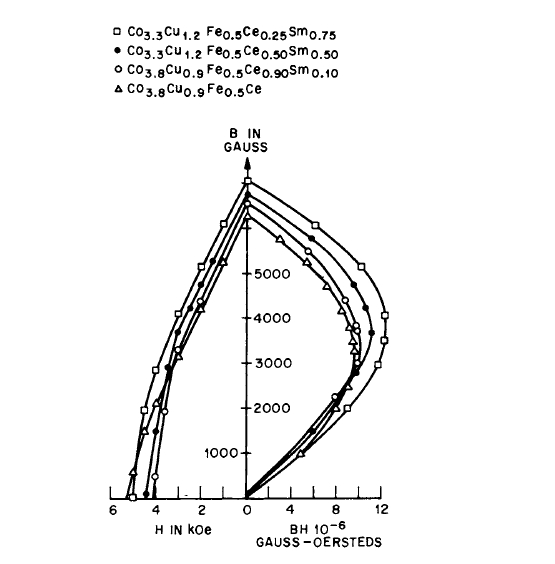
Figure 4.21 Permanent magnet properties of alloys with an increasing amount of Sm substituted for Ce. The effect of increasing Sm is to increase the maximum energy product.
the \(B\) demagnetization and energy product curves for these alloys. It is evident from the figure that the addition of samarium increases the energy product.
Four intrinsic demagnetization curves are shown in Figure
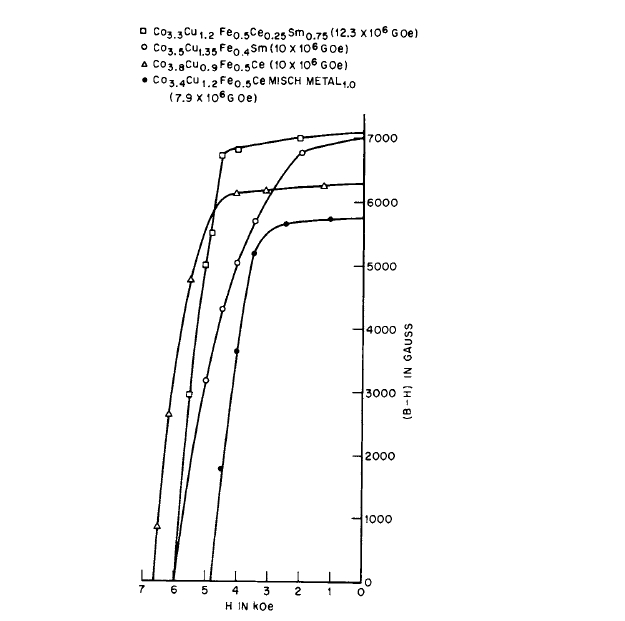
Figure 4.22 Intrinsic permanent magnet properties of four alloys: one containing Ce; the second containing Sm; the third containing both Ce and Sm; and the fourth containing a commercial 90% Ce misch metal
4.22 for comparison. One is for the alloy containing cerium only, a second containing samarium only, a third containing cerium and samarium, and finally one for an alloy containing a commercial 90% Ce misch metal. Energy product values are also given. The samarium alloy has a higher energy - product potential than the value of \(10\times10^{6}\text{ G - Oe}\) shown, since its demagnetization curve is not square. Better casting techniques than those employed for this study are needed to realize its potential. The Ce - Sm alloy yields the highest energy product; the cerium alloy shows the highest coercive force. The alloy containing the commercial 90% Ce misch metal (approximate composition 90 - 92% Ce, 4 - 7% La, 0.5 - 1.5% Pr, 2.5 - 3.5% Nd) has a lower energy product than the pure cerium alloy, but it has a lower materials cost. This alloy can be combined with pure cerium (75% Ce with 25% of 90% Ce misch metal or other combinations) in order to improve its energy product and coercive force values.
Optical Metallography: Examining Microstructures of Magnetic Alloys
It is apparent from the above discussion that the optimum magnetic properties of the Co - Cu - Fe - R alloys are achieved by a suitable combination of heat treatments. These heat treatments result in the precipitation of a finely dispersed phase. Phase diagram information for these multicomponent alloys are not available, but from an examination of the known binary diagrams it is apparent that the phase relationships for these alloys will be complex. Nevertheless, much useful information concerning the solid - state processes occurring in these systems can be obtained by metallographic examination in conjunction with the binary diagrams, x - ray, electron microscope, and electron microprobe studies, and DTA.
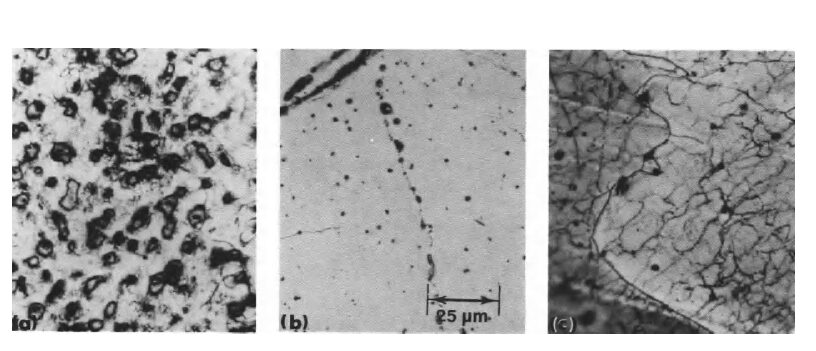
Figure 4.23 Microstructure of an arc melt of \(\text{Co}_{3}\text{Cu}_{1.6}\text{Fe}_{0.5}\text{Ce}\): (a) as cast plus \(400^{\circ}\text{C}\) for 4 hr, (b) \(1000^{\circ}\text{C}\) - quenched, (c) \(1000^{\circ}\text{C}\), 30 min cooling at \(1^{\circ}\text{C/sec}\), plus \(400^{\circ}\text{C}\) for 4 hr. In (b) the structure is greatly homogenized as a result of heating at \(1000^{\circ}\text{C}\) and quenching. In (c) are the dark outlines of the subgrains which are associated with the precipitation process of a second phase. (After Chin et al. [9].)
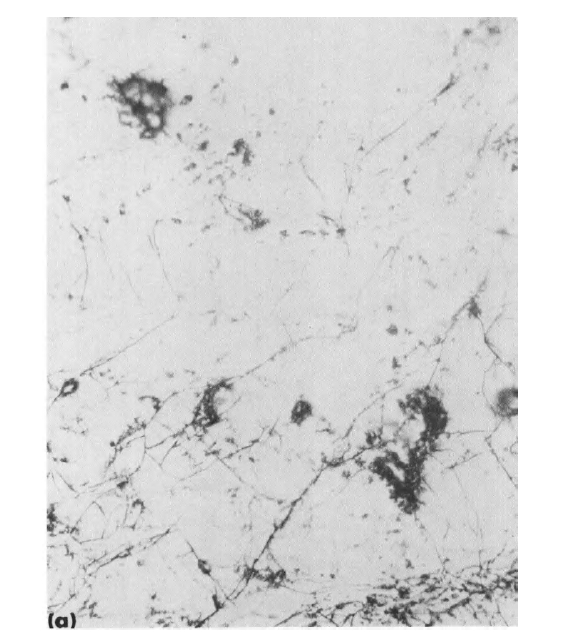
Figure 4.24 Microstructure (\(\times252\)) in (a) of \(\text{Co}_{5}\text{Sm}\) after electropolishing and etching. Photograph indicates single - phase material
(b) Microstructure (\(\times252\)) of \(\text{Cu}_{5}\text{Sm}\) after electro polishing and etching. The photograph indicates two phase material. (After Nesbitt [6].)
Figure 4.23 shows the microstructure of \(\text{Co}_{3}\text{Cu}_{1.6}\text{Fe}_{0.5}\text{Ce}\) after (a) arc casting plus aging at \(400^{\circ}\text{C}\), (b) after quenching from \(1000^{\circ}\text{C}\), and (c) after solution treatment at \(1000^{\circ}\text{C}\) cooled at the rate of \(1^{\circ}\text{C/sec}\), then aged at \(400^{\circ}\text{C}\). Previous work has shown that, in general, the nonmagnetic copper - rich phase etches dark and the magnetic cobalt - rich phase etches light [6]. In Figure 4.23a, the microstructure corresponding to the first treatment shows considerable segregation. In Figure 4.23b the microstructure is more uniform as a result of the \(1000^{\circ}\text{C}\) solution treatment and quench. It etches light, suggesting that the structure is mostly a supersaturated solid solution of the magnetic phase that is cobalt rich. The coercive force of this alloy is 2000 Oe in this condition. In Figure 4.23c, as a result of the solution and aging treatment, a fine precipitation of a dark phase around the grain boundaries is evident, corresponding to an increase in the coercive force to 11,000 Oe.
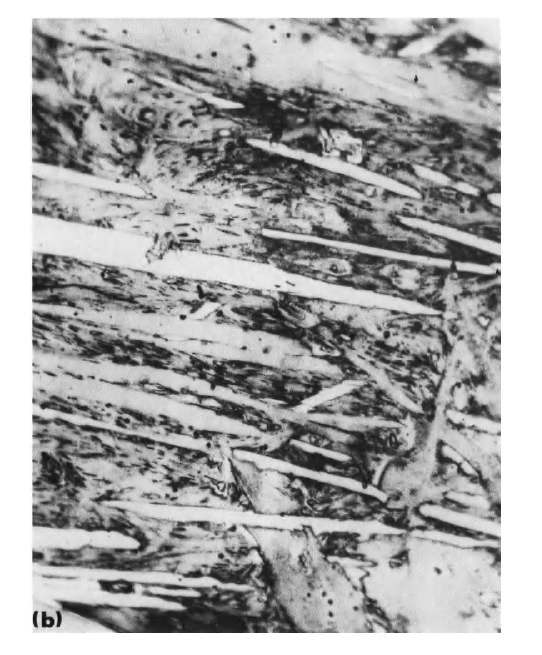
Figure 4.24 shows micrographs of the two end members \(\text{Co}_{5}\text{Sm}\) and \(\text{Cu}_{5}\text{Sm}\) of the cobalt - copper - samarium alloys [6]. The \(\text{Co}_{5}\text{Sm}\) microstructure indicates a single phase structure, and it appears light after etching. On the other hand, the microstructure for \(\text{Cu}_{5}\text{Sm}\) is multiphase and generally etches dark with the same reagent. This microstructure suggests that \(\text{Cu}_{5}\text{Sm}\) forms peritectically—more so than \(\text{Co}_{5}\text{Sm}\). Figure 4.25 shows a micrograph of a section through a 1 - in. diameter button (cast in an arc furnace) having the composition \(\text{Co}_{3.45}\text{Fe}_{0.25}\text{Cu}_{1.35}\text{Sm}\). The micrograph shows light and dark areas, which are interpreted as areas rich in \(\text{Co}_{5}\text{Sm}\) and \(\text{Cu}_{5}\text{Sm}\), respectively. The bottom of the ingot, since it freezes first because it is in contact with the water - cooled hearth, appears to have less of the \(\text{Cu}_{5}\text{Sm}\) - rich phase present. The top portion of the ingot freezes last, and more of the \(\text{Cu}_{5}\text{Sm}\) phase appears to be present. Striations through the thickness
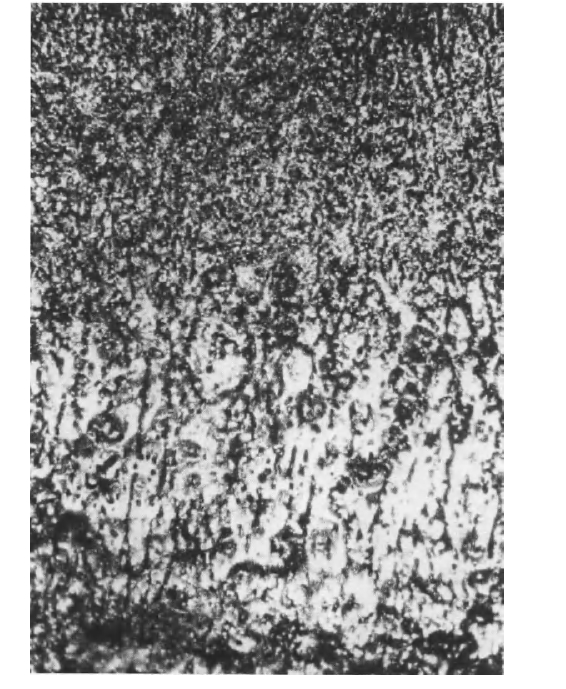
Figure 4.25 Microstructure of cross - section of a 1 - in. diam button (cast in an arc furnace) of \(\text{Co}_{3.45}\text{Fe}_{0.25}\text{Cu}_{1.35}\text{Sm}\). Light and dark areas are interpreted as areas rich in \(\text{Co}_{5}\text{Sm}\) and \(\text{Cu}_{5}\text{Sm}\), respectively. Striations through the thickness of the button and the direction of the temperature gradient are evident. (After Nesbitt [6].)
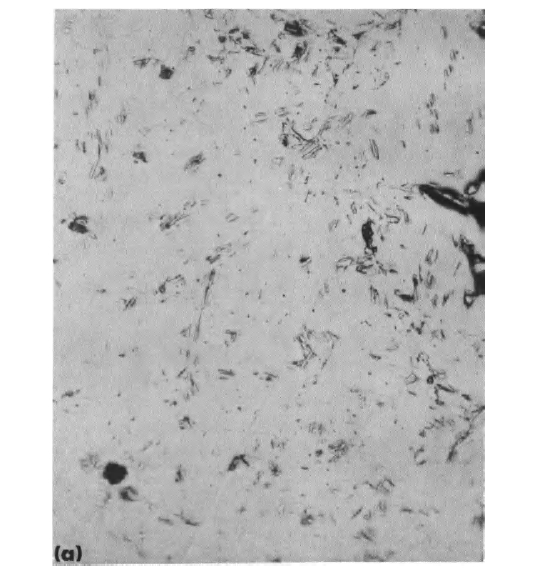
Figure 4.26 Microstructure of an arc - melted button of \(\text{Co}_{3.4}\text{Cu}_{1.2}\text{Fe}_{0.5}\text{Ce}_{0.6}\text{Sm}_{0.4}\). In (a), the cast structure is shown, revealing dark areas that are copper - rich. In (b), the alloy has been
of the button in the direction of the temperature gradient are evident in Figure 4.25. The directional properties of the microstructure appear to be associated with the directional magnetic properties of the button. Because of the very high crystal anisotropy of these alloys, directional effects play an
homogenized at \(1050^{\circ}\text{C}\) and aged at \(400^{\circ}\text{C}\) for 8 hr; the microstructure appears to be single - phase. (\(\times290\)).
extremely important role in the final permanent magnet properties of the button. The effects of aging the alloy at \(400^{\circ}\text{C}\), which greatly enhances the coercive force, do not appear in the microstructure at ordinary magnifications.
Figure 4.26 shows the microstructure of an arc - melted
button \(\text{Co}_{3.4}\text{Cu}_{1.2}\text{Fe}_{0.5}\text{Ce}_{0.6}\text{Sm}_{0.4}\). In (a), the as - cast structure is shown, revealing dark areas that are copper - rich. In (b), the alloy has been homogenized at \(1050^{\circ}\text{C}\) and aged at \(400^{\circ}\text{C}\) for 8 hr, and the microstructure appears to be single - phase. Apparently, the precipitated permanent magnet phase is so finely dispersed that it cannot be observed by the optical microscope. Hofer [12] has reported phase separation, resembling spinoidal decomposition, in \(\text{Co}-\text{Cu}-\text{Sm}\) alloys after annealing up to \(1000^{\circ}\text{C}\).
Electron Diffraction and Metallography: Techniques for Magnetic Material Analysis
Although the optical metallography results indicate the need for higher resolution studies of \(\text{Cu}_{5}\text{Ce}-\text{Co}_{5}\text{Ce}\) alloy structures, transmission electron microscopy studies have been frustrated by lack of suitable specimen thinning techniques. Recently, however, suitable specimen thinning techniques have been developed, and preliminary electron microscope observations by Leamy and Green [13] have revealed the fine precipitate structure in directionally solidified samples.
The structure of a solution - treated and air - cooled \(\text{Co}_{3.8}\text{Fe}_{0.5}\text{Cu}_{0.9}\text{Ce}\) alloy is shown in Figure 4.27. The diffraction data obtained from this specimen may be indexed on the basis of the \(\text{Co}_{5}\text{Ce}\) structure [14] alone, no additional Bragg reflections being present. However, electron transmission images of the specimen indicate that it is inhomogeneous. The mottled contrast in Figure 4.27a arises as a result of strain in the alloy lattice, presumably created by a dense array of fine, coherent precipitates. Further evidence for inhomogeneity is given by the observation of diffuse intensity in the electron diffraction patterns of this specimen. As shown
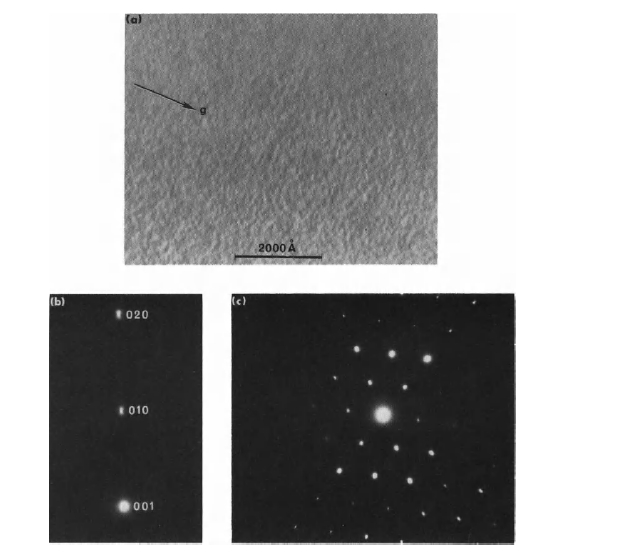
Figure 4.27 Solution - treated and air - cooled \(\text{Co}_{3.8}\text{Fe}_{0.5}\text{Cu}_{0.9}\text{Ce}\) alloy: (a) Bright - field electron transmission micrograph. \(g = \overline{2}10\), \(w\sim0\). (b) Optical enlargement of an electron diffraction pattern obtained from the specimen shown in (a). The “sidebands” at \(\overline{g}=010\) and \(\overline{g}=020\) are clearly visible. (c) An electron diffraction pattern obtained from the specimen shown in (a). In this pattern, the strong diffuse scattering at each Bragg reflection produces an apparent elongation of the diffracted spot. Note that this elongation is always parallel to \(\overline{g}\). (After Leamy and Green [13].)
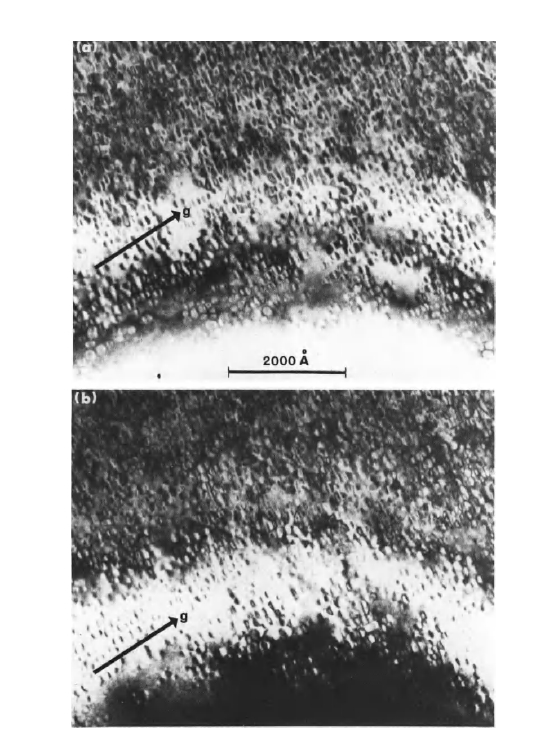
Figure 4.28 The structure of a \(\text{Co}_{3.2}\text{Fe}_{0.8}\text{CuCe}\) alloy, aged at \(500^{\circ}\text{C}\) for 5 hr. The strain contrast associated with coherent precipitates is visible in both the \(\overline{g}=110\) bright - field image (a) and the \(\overline{g}=110\) dark - field image (b). Precipitate particles are approximately 150 Å in diameter. (After Leamy and Green [13].)
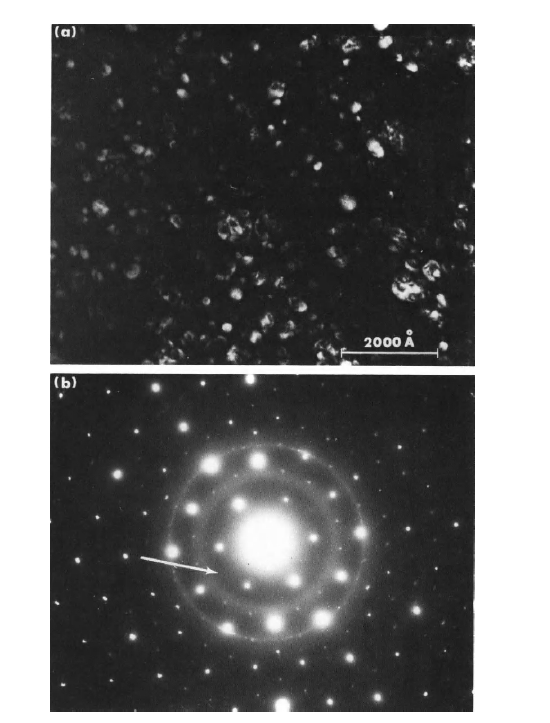
Figure 4.29 \(\text{Co}_{3.8}\text{Fe}_{0.5}\text{Cu}_{0.9}\text{Ce}\), aged at \(600^{\circ}\text{C}\) for 3 hr: A dark - field micrograph, formed with the weak \(\text{Co}_{17}\text{Ce}_{2}\) structure reflection shown arrowed in (b). An (001) electron diffraction pattern which contains weak \(\text{Co}_{17}\text{Ce}_{2}\) reflections in addition to the stronger \(\text{Co}_{5}\text{Ce}\) structure reflections. Note that no diffuse scattering is apparent in this pattern. (After Leamy and Green [13].)
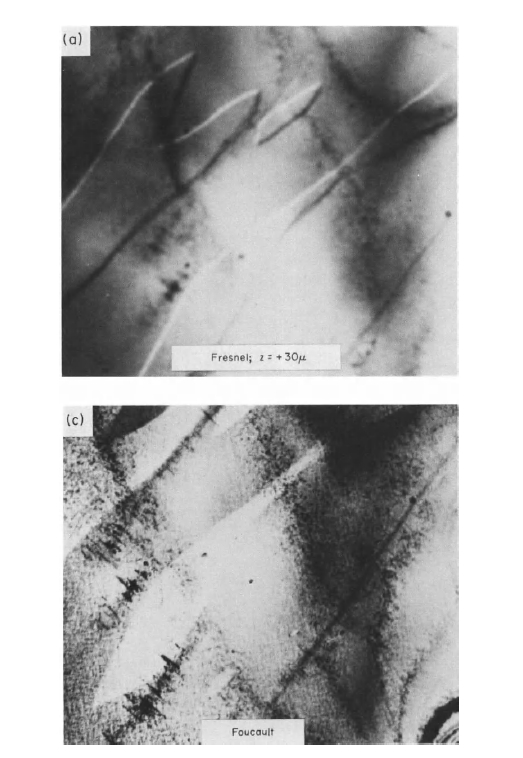
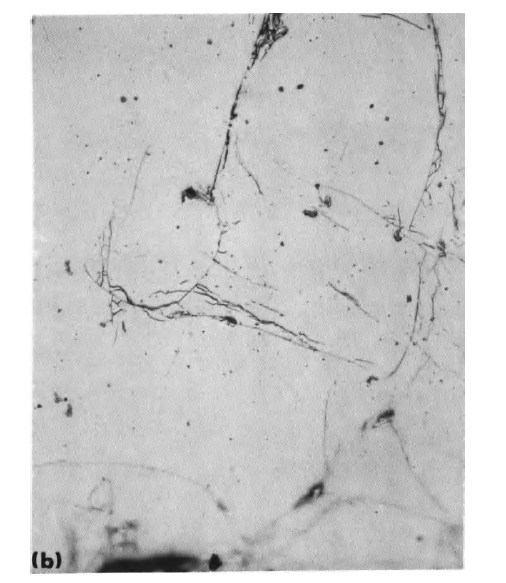
Figure 4.30 Electron micrographs of magnetic domains in \(\text{Co}_{3.4}\text{Fe}_{0.6}\text{CuCe}_{1.09}\) lying along the easy axis of magnetization. Photographs (a), (b), and (c) are for different focusing conditions;
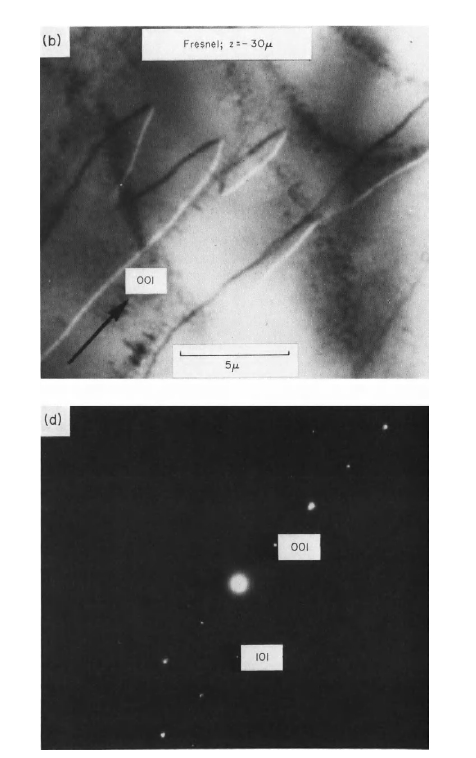
(d) is the corresponding diffraction pattern. (After Leamy and Green [13].)
in Figures 4.27b and 4.27c, the diffuse scattering appears as “sidebands” on both sides of each Bragg reflection, is positioned along a line from the origin to the reflection in question, and is not observed at the origin.
The structure of a \(\text{Co}_{3.2}\text{Fe}_{0.8}\text{CuCe}\) alloy, aged for 5 hr at \(500^{\circ}\text{C}\) is shown in Figure 4.28 (coercive force \(_{M}H_{c}\) is approximately 4000 Oe). In this specimen, the coherent particles are clearly visible, in thin areas of the specimen where particle overlap in the image does not obscure the strain contrast [15] of the individual precipitates. The particles are roughly spherical, and \(\sim150\) Å in diameter. The particle number density is approximately \(4\times10^{16}/\text{cm}^{3}\). In this alloy, the diffuse diffracted intensity described above is also observed, although relatively more intense appears on the high angle side of each reflection.
Finally, the structure of a \(\text{Co}_{3.8}\text{Fe}_{0.5}\text{Cu}_{0.9}\text{Ce}\) alloy aged for three hours at \(600^{\circ}\text{C}\) is shown in Figure 4.29. For this specimen composition and heat treatment, easily resolved particles of \(\sim250 - 350\) Å diam are formed (the coercive force \(_{M}H_{c}\) is approximately 2000 Oe). In addition, the diffuse scattering is no longer detectable in the diffraction pattern, where additional weak Bragg reflections are observed. These extra - reflections correspond to the \(\text{Co}_{17}\text{Ce}_{2}\) structure (either the hexagonal or rhombohedral modification), and the dark field micrograph in Figure 4.29 suggests that the precipitates possess this structure. In Figure 4.30, forked magnetic domains are clearly visible and are lying along the easy axis of magnetization (\(c\) axis). Their widths are approximately 5 \(\mu\text{m}\). Photographs (a), (b), and (c) are for different focusing conditions; (d) is the corresponding diffraction pattern.
These preliminary transmission electron microscopy experiments have thus verified the hypothesis put forward on the basis of magnetic property measurements; i.e., the copper -
containing rare - earth magnet alloys are magnetically hardened via precipitation of a second phase. These studies show, furthermore, that this phase precipitates as an extremely dense array of coherent particles.
Mechanism of Magnetization: How Magnetic Materials Functionn
In order to understand the intrinsic behavior of the \(\text{Co}-\text{Fe}-\text{Cu}-\text{R}\) permanent magnets, it is important to consider a number of factors such as magnetocrystalline anisotropy, domain wall thickness, and domain wall energy.
The value of \(K_{u}\) can be determined from measurements of \(H_{A}\) and \(M_{s}\), as mentioned in Chapter I. The relationship follows from the expression \[H_{A}=2\frac{K_{u}}{M_{s}}\] (1) applicable to magnetization in the hard - axis direction. In Chapter III, values of \(K_{u}\) for these compounds were shown to be of the order of \(10^{7}\text{ erg/cm}^{3}\). \(K_{u}\) is important in determining the domain structure of these permanent magnets. The domain wall width \(d\) is given by \[d\propto\left(\frac{A}{K_{u}}\right)^{1/2}\] (2) where \(A\) is the exchange constant. It is assumed to be the same for iron in this discussion because the Curie points of \(\text{Fe}\) and \(\text{Co}-\text{Fe}-\text{Cu}-\text{R}\) alloys are roughly equal. It is well known that the width of the domain wall in iron is approximately 1000 Å and that the anisotropy of iron is of the order of \(10^{5}\text{ erg/cm}^{3}\). The anisotropy of the \(\text{Co}-\text{Cu}-\text{R}\) magnets is about 100 times that of iron, and therefore, according to relation (2),
their domain wall widths are approximately 100 Å. In addition, where \(\sigma_{w}\) is the domain wall energy. \[ \sigma_{w}\propto(AK_{u})^{1/2}\] (3) Thus, this domain wall energy is approximately ten times greater in the \(\text{Co}-\text{Fe}-\text{Cu}-\text{R}\) materials than in iron.
The domain wall widths of approximately 100 Å are in the same size region as the precipitates shown earlier (Figure 4.28). Hence, domain wall pinning by precipitates is the most likely mechanism giving rise to the coercive force in the \(\text{Co}-\text{Fe}-\text{Cu}-\text{R}\) magnets. As further evidence of the suggested mechanism, a thermally demagnetized single - crystal specimen of \(\text{Co}_{3.5}\text{Fe}_{0.5}\text{CuCe}_{1.09}\) was magnetized along the easy direction (\(c\) axis). The results are given in Figure 4.31. The magnetization remained substantially constant until the coercive
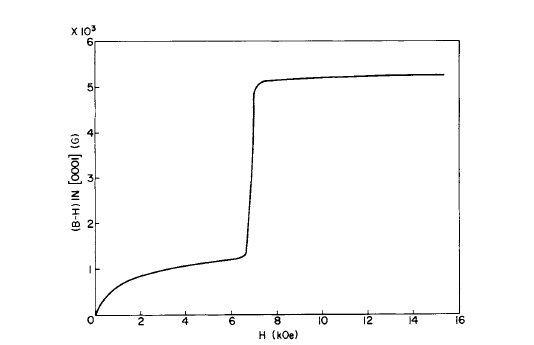
Figure 4.31 Magnetization curve for a thermally demagnetized, heat - treated single crystal of \(\text{Co}_{3.5}\text{Fe}_{0.5}\text{CuCe}_{1.09}\) showing the effect of domain wall pinning sites.
cive force value was reached, and then the magnetization increased abruptly. Since domain walls were observed in the thermally demagnetized state, this abrupt change of magnetization at the value of the coercive force gives strong support to a domain wall pinning mechanism.
Thermal Properties of Magnetic Alloys: Temperature Effects on Magnetism
Figure 4.32 shows the magnetization - temperature behavior of a specimen of \(\text{Co}_{3.5}\text{CuFe}_{0.5}\text{Ce}\) measured in a field of 2000 Oe. This sample was previously heat treated for maximum permanent magnet properties. On heating, the magnetization
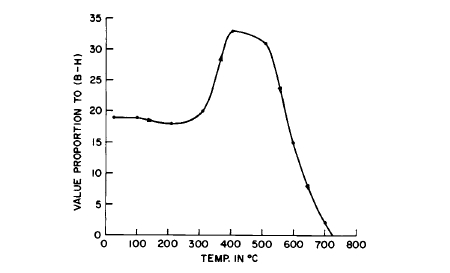
Figure 4.32 Magnetization versus temperature for \(H = 2000\) Oe on a specimen of \(\text{Co}_{3.5}\text{CuFe}_{0.5}\text{Ce}\). Data points are for test on center of 1 - in. diameter button heat treated for maximum permanent magnet properties. The Curie point of \(725^{\circ}\text{C}\) depends upon heat treatment.
The temperature coefficient of magnetization can be altered in these cast and powder magnets by replacing small amounts of the light rare - earth element with a heavy rare - earth [11].
increases with increasing temperature, suggesting a decrease in anisotropy. At about \(400^{\circ}\text{C}\), the magnetization begins to decrease. The curve intersects the temperature axis at \(725^{\circ}\text{C}\). To some extent, the Curie point of \(\sim725^{\circ}\text{C}\) depends upon heat treatment, but it also depends critically on the Ce - content. There is a possibility that \(\text{Co}_{17}\text{Ce}_{2}\) is present in the Ce alloy, and this could account for the high Curie point.
The variation of the magnetization with temperature for \(\text{Co}_{3.5}\text{Fe}_{0.4}\text{Cu}_{1.35}\text{Sm}\) is shown in Figure 4.33. The applied field was 2000 Oe. As with the Ce alloy, the magnetization also increases with temperature, suggesting a decrease in anisotropy. When the magnetization decreases, it does so in a somewhat nonuniform manner. In this respect it is again similar to the behavior of the Ce alloy. However, its magnetization curve decreases more slowly than that of the Ce alloy, and it has a higher Curie temperature. These magnetization curves for copper - containing alloys cannot be compared directly with those of the binary 5:1 compounds, since they have additional phases present. In general, a small increase
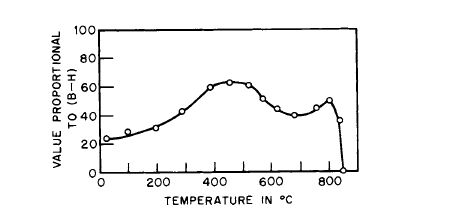
Figure 4.33 Magnetization versus temperature for \(H = 2000\) Oe on the alloy \(\text{Co}_{3.5}\text{Fe}_{0.4}\text{Cu}_{1.35}\text{Sm}\). The Curie point is approximately \(850^{\circ}\text{C}\).
in the cobalt content of the alloys increases their Curie points and also their permanent - magnet properties.
Differential thermal analysis was used to further study thermal effects [4, 11]. Figure 4.34 shows the differential temperature plotted against temperature of the specimen for four alloys having different copper contents. The data represent the decreasing temperature branch of the DTA curves. For the alloys \(\text{Co}_{3.94}\text{Cu}_{0.5}\text{Fe}_{0.56}\text{Ce}\), \(\text{Co}_{3.5}\text{CuFe}_{0.5}\text{Ce}\), \(\text{Co}_{3.06}\text{Cu}_{1.5}\text{Fe}_{0.44}\text{Ce}\), and \(\text{Co}_{2.63}\text{Cu}_{2.0}\text{Fe}_{0.39}\text{Ce}\), the freezing points are respectively 1133, 1100, 1086, and \(1080^{\circ}\text{C}\).
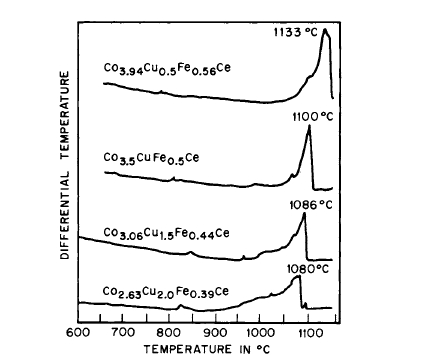
Figure 4.34 Differential thermal analysis curves on four \(\text{Co}-\text{Ce}\) alloys containing different amounts of copper. Freezing points vary from \(1133^{\circ}\text{C}\) for the low - copper alloy to \(1080^{\circ}\text{C}\) for the high - copper alloy. Peaks in cooling curves suggest additional transitions which are not yet identified. (After Nesbitt et al. [4].)
data show that the freezing points decrease as the copper content increases. It is evident from Figure 4.34 that there are several small peaks in the cooling curves; in general, these have not been identified. This reflects the complex nature of the phase relations in these multicomponent alloys.
Some additional results of differential thermal analysis are shown in Figure 4.35 [11]. The differential temperature is plotted against the temperature of the specimen for five alloys.
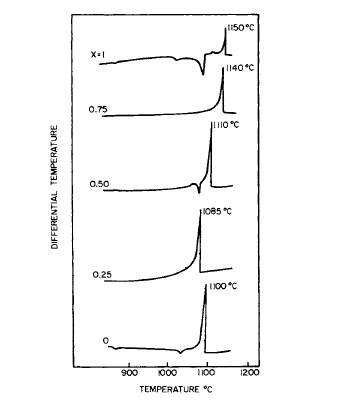
Figure 4.35 Differential thermal analysis curves on five alloys containing different percentages of Ce and Sm. The alloys are expressed by the formula \(\text{Co}_{3 - x}\text{Cu}_{1 + x}\text{Fe}_{0.5}\text{Sm}_{x}\text{Ce}_{1 - x}\) for the values of \(x = 1, 0.75, 0.50, 0.25\) and \(0\). From the curves it is evident that the addition of Sm raises the freezing point of the alloys. (After Nesbitt et al. [11].)
containing different percentages of Ce and Sm. The alloys are expressed by the formula \(\text{Co}_{3 - x}\text{Cu}_{1 + x}\text{Fe}_{0.5}\text{Sm}_{x}\text{Ce}_{1 - x}\), where \(x = 1, 0.75, 0.50, 0.25\), and \(0\). The freezing points are \(1150\), \(1140\), \(1110\), \(1085\), and \(1100^{\circ}\text{C}\), respectively. From these data, it is evident that the addition of Sm raises the freezing point of the alloys. As in the case of the Ce alloys, several unidentified peaks were observed in the cooling curves.
Appendix 4.1
The measurement of the magnetic moment of a specimen by the pendulum magnetometer technique* is accomplished by balancing the moment of the specimen against that of a surrounding current - carrying coil so that the net moment of the system is zero. In this instrument, the coil is fixed on the end of a rod and suspended in a gradient field so that it is free to move, as a pendulum, in the direction of the gradient field as shown in Figure A4.1. Strain gages are glued on a flat strip as phosphor bronze at the opposite end of the rod. These gages are connected in a bridge circuit whose output is used to sense displacement of the pendulum. When a paramagnetic or ferromagnetic material is placed in the coil, the direction of displacement will be toward the higher field region; for diamagnetic materials the displacement will be toward the lower field region.
R. C. Sherwood of Bell Laboratories has increased the sensitivity of the null - coil pendulum magnetometer by an
* C. A. Domenicali, Rev. Sci. Instrum. 21, 327 (1950). R. M. Bozorth, H. J. Williams, and D. E. Walsh, Phys. Rev. 103, 572 (1956).
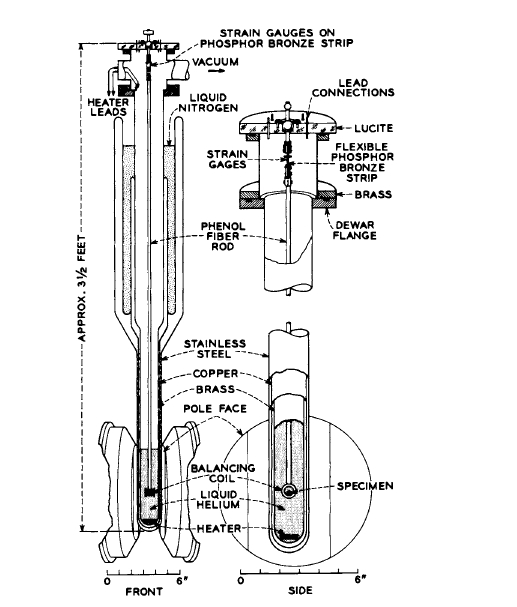
Figure A4.1 Null-coil pendulum magnetometer.
order of magnitude, so that magnetic moments of \(6\times10^{-5}\) emu can now be detected. This high sensitivity was obtained primarily by the use of silicon strain gages and a more stable bridge circuit.


